Qantas 2007 Annual Report Download - page 137
Download and view the complete annual report
Please find page 137 of the 2007 Qantas annual report below. You can navigate through the pages in the report by either clicking on the pages listed below, or by using the keyword search tool below to find specific information within the annual report.-
 1
1 -
2
-
3
-
4
-
5
-
6
-
7
-
8
-
9
-
10
-
11
-
12
-
13
-
14
-
15
-
16
-
17
-
18
-
19
-
20
-
21
-
22
-
23
-
24
-
25
-
26
-
27
-
28
-
29
-
30
-
31
-
32
-
33
-
34
-
35
-
36
-
37
-
38
-
39
-
40
-
41
-
42
-
43
-
44
-
45
-
46
-
47
-
48
-
49
-
50
-
51
-
52
-
53
-
54
-
55
-
56
-
57
-
58
-
59
-
60
-
61
-
62
-
63
-
64
-
65
-
66
-
67
-
68
-
69
-
70
-
71
-
72
-
73
-
74
-
75
-
76
-
77
-
78
-
79
-
80
-
81
-
82
-
83
-
84
-
85
-
86
-
87
-
88
-
89
-
90
-
91
-
92
-
93
-
94
-
95
-
96
-
97
-
98
-
99
-
100
-
101
-
102
-
103
-
104
-
105
-
106
-
107
-
108
-
109
-
110
-
111
-
112
-
113
-
114
-
115
-
116
-
117
-
118
-
119
-
120
-
121
-
122
-
123
-
124
-
125
-
126
-
 127
127 -
 128
128 -
 129
129 -
 130
130 -
 131
131 -
 132
132 -
 133
133 -
 134
134 -
 135
135 -
 136
136 -
 137
137 -
 138
138 -
 139
139 -
 140
140 -
 141
141 -
 142
142 -
 143
143 -
 144
144
 |
 |

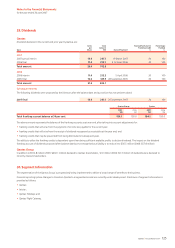
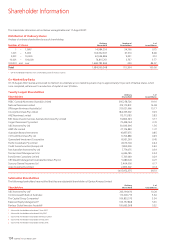
135Qantas |Annual Report 2007
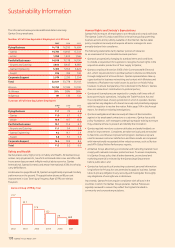
Share Information Unit 2007 2006 2005 2004 2003
Dividends per share cents 30.0 22.0 20.0 17.0 17.0
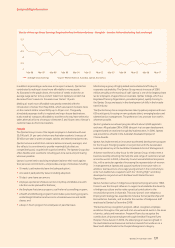
Share price – high $ 5.83 4.17 3.73 3.81 4.88
Share price – low $ 2.93 2.93 3.13 3.08 2.85
Share price – closing $ 5.60 2.96 3.37 3.52 3.27
Weighted average number of ordinary shares (basic) M 1,976.8 1,927.7 1,869.2 1,815.4 1,721.2
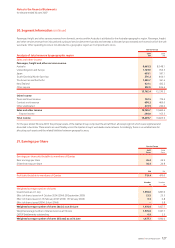
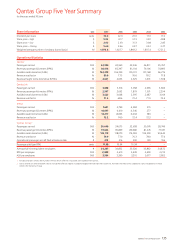
Operational Statistics
Qantas1
Passengers carried 000 24,950 24,960 25,546 26,811 25,357
Revenue passenger kilometres (RPKs) M 84,418 82,397 81,104 79,106 74,893
Available seat kilometres (ASKs) M 104,379 106,359 105,911 101,168 96,276
Revenue seat factor % 80.9 77.5 76.6 78.2 77.8
Revenue freight tonne kilometres (RFTKs) M 2,621 2,633 2,329 1,601 1,598
QantasLink
Passengers carried 000 3,858 3,316 3,058 2,996 3,389
Revenue passenger kilometres (RPKs) M 2,507 2,092 1,879 1,931 2,294
Available seat kilometres (ASKs) M 3,523 3,048 2,595 2,687 3,169
Revenue seat factor % 71.2 68.6 72.4 71.9 72.4
Jetstar
Passengers carried 000 7,641 5,799 4,384 315 –
Revenue passenger kilometres (RPKs) M 10,697 6,410 4,346 277 –
Available seat kilometres (ASKs) M 14,217 8,663 6,004 383 –
Revenue seat factor % 75.2 74.0 72.4 72.3 –
Qantas Group2
Passengers carried 000 36,449 34,075 32,658 30,076 28,746
Revenue passenger kilometres (RPKs) M 97,622 90,899 86,986 81,276 77,187
Available seat kilometres (ASKs) M 122,119 118,070 114,003 104,200 99,445
Revenue seat factor % 79.9 77.0 76.3 78.0 77.6
Operational passenger aircraft fleet at balance date # 213 216 200 190 196
Passenger yield (per RPK) cents 11.69 10.94 10.34 – –
Average full-time equivalent employees # 34,267 34,832 35,520 33,862 34,872
RPK per employee 000 2,849 2,610 2,449 2,400 2,213
ASK per employee 000 3,564 3,390 3,210 3,077 2,852
Includes prior year statistics for Australian Airlines which, effective 1 July 2006, are included within Qantas.
Qantas and Jetstar 2005 and 2004 statistics include the effect of a domestic codeshare agreement between the two airlines. However, the effect of this codeshare is only included once in these
statistics for the Qantas Group.
1
2
Qantas Group Five Year Summary
for the years ended 30 June