Qantas 2007 Annual Report Download - page 138
Download and view the complete annual report
Please find page 138 of the 2007 Qantas annual report below. You can navigate through the pages in the report by either clicking on the pages listed below, or by using the keyword search tool below to find specific information within the annual report.-
 1
1 -
2
-
3
-
4
-
5
-
6
-
7
-
8
-
9
-
10
-
11
-
12
-
13
-
14
-
15
-
16
-
17
-
18
-
19
-
20
-
21
-
22
-
23
-
24
-
25
-
26
-
27
-
28
-
29
-
30
-
31
-
32
-
33
-
34
-
35
-
36
-
37
-
38
-
39
-
40
-
41
-
42
-
43
-
44
-
45
-
46
-
47
-
48
-
49
-
50
-
51
-
52
-
53
-
54
-
55
-
56
-
57
-
58
-
59
-
60
-
61
-
62
-
63
-
64
-
65
-
66
-
67
-
68
-
69
-
70
-
71
-
72
-
73
-
74
-
75
-
76
-
77
-
78
-
79
-
80
-
81
-
82
-
83
-
84
-
85
-
86
-
87
-
88
-
89
-
90
-
91
-
92
-
93
-
94
-
95
-
96
-
97
-
98
-
99
-
100
-
101
-
102
-
103
-
104
-
105
-
106
-
107
-
108
-
109
-
110
-
111
-
112
-
113
-
114
-
115
-
116
-
117
-
118
-
119
-
120
-
121
-
122
-
123
-
124
-
125
-
126
-
127
-
 128
128 -
 129
129 -
 130
130 -
 131
131 -
 132
132 -
 133
133 -
 134
134 -
 135
135 -
 136
136 -
 137
137 -
 138
138 -
 139
139 -
 140
140 -
 141
141 -
 142
142 -
 143
143 -
 144
144
 |
 |
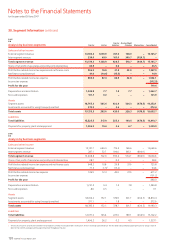
Sustainability Information
Guidelines
The Global Reporting Initiative’s G3 guidelines and recommendations were
taken into account in drafting the sustainability information provided.
The data is provided for the information of a wide range of stakeholders
including customers, shareholders, employees, suppliers, regulators,
politicians, non-government organisations, financiers and various special
interest groups.
The sustainability information applies to the Qantas Group unless
otherwise indicated. Whilst specific sustainability forums were not held,
Qantas continually undertakes extensive research on customer attitudes,
has mature stakeholder feedback processes in place, and uses a risk
management system to capture feedback from various internal and
external sources.
Qantas’ sustainability reporting will continue to develop over time, and in
future will incorporate improvements in issue identification, strategies,
and/or data completeness.
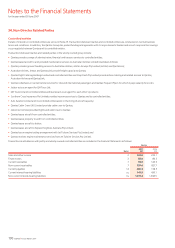
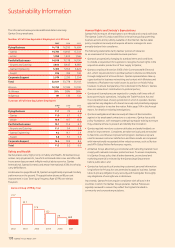
Environmental Impacts
Qantas acknowledges the importance of managing and minimising
adverse environmental impacts caused by its operations. The information
below provides additional data on the impact our operations have on the
environment.
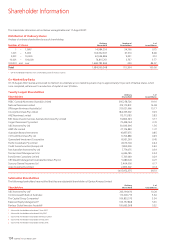
Energy consumption Units 2007 2006 2005
Aviation fuel 000 L 4,680,270 4,561,238 4,392,991
Electricity (Australia) MWh 241,324 236,858 231,095
Gas (Australia) Gj 305,803 289,463 292,959
Ground petrol and
diesel (Australia) 000 L 7,086 6,998 7,023
Emissions
CO2
– Aviation Tonnes 11,499,423 11,206,962 10,793,578
– Ground (Australia) Tonnes 20,135 19,730 20,109
NOX 1
– Aviation (Qantas) Tonnes 3,387 3,273 3,294
Aviation efficiency
CO2 per 100 RTKs
(Qantas) Kgs 94.4 97.1 99.1
Fuel per 100 RTKs
(Qantas) L38.4 39.5 40.3
NOX per 100 million
RTKs (Qantas) Tonnes 31.6 32.4 34.4
Unplanned events
Fuel jettison No. of times 11 13 n/a
Fuel spills2No. of times 67 65 53
Calculated for Qantas jet aircraft emissions below 3,000 feet using standard engine
certification emission factors.
At least 65 per cent of fuel spills were categorised as minor (less than 100 litres).
All Qantas Group airlines also comply with the relevant International
Civil Aviation Organization noise standards.
Qantas has engaged specialist advisers to audit water usage at key sites
and to recommend strategies to better manage and reduce
consumption. Qantas maintains a clean aircraft fleet to improve fuel
efficiency and reduce emissions. The water used to clean the aircraft is
recycled. In addition, Qantas is working with waste management service
providers to analyse waste disposal volumes and recycling rates.
1
2
•
•
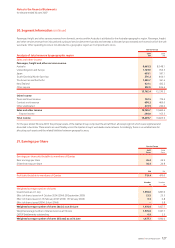
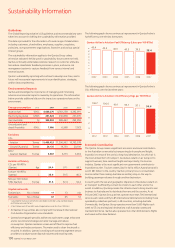
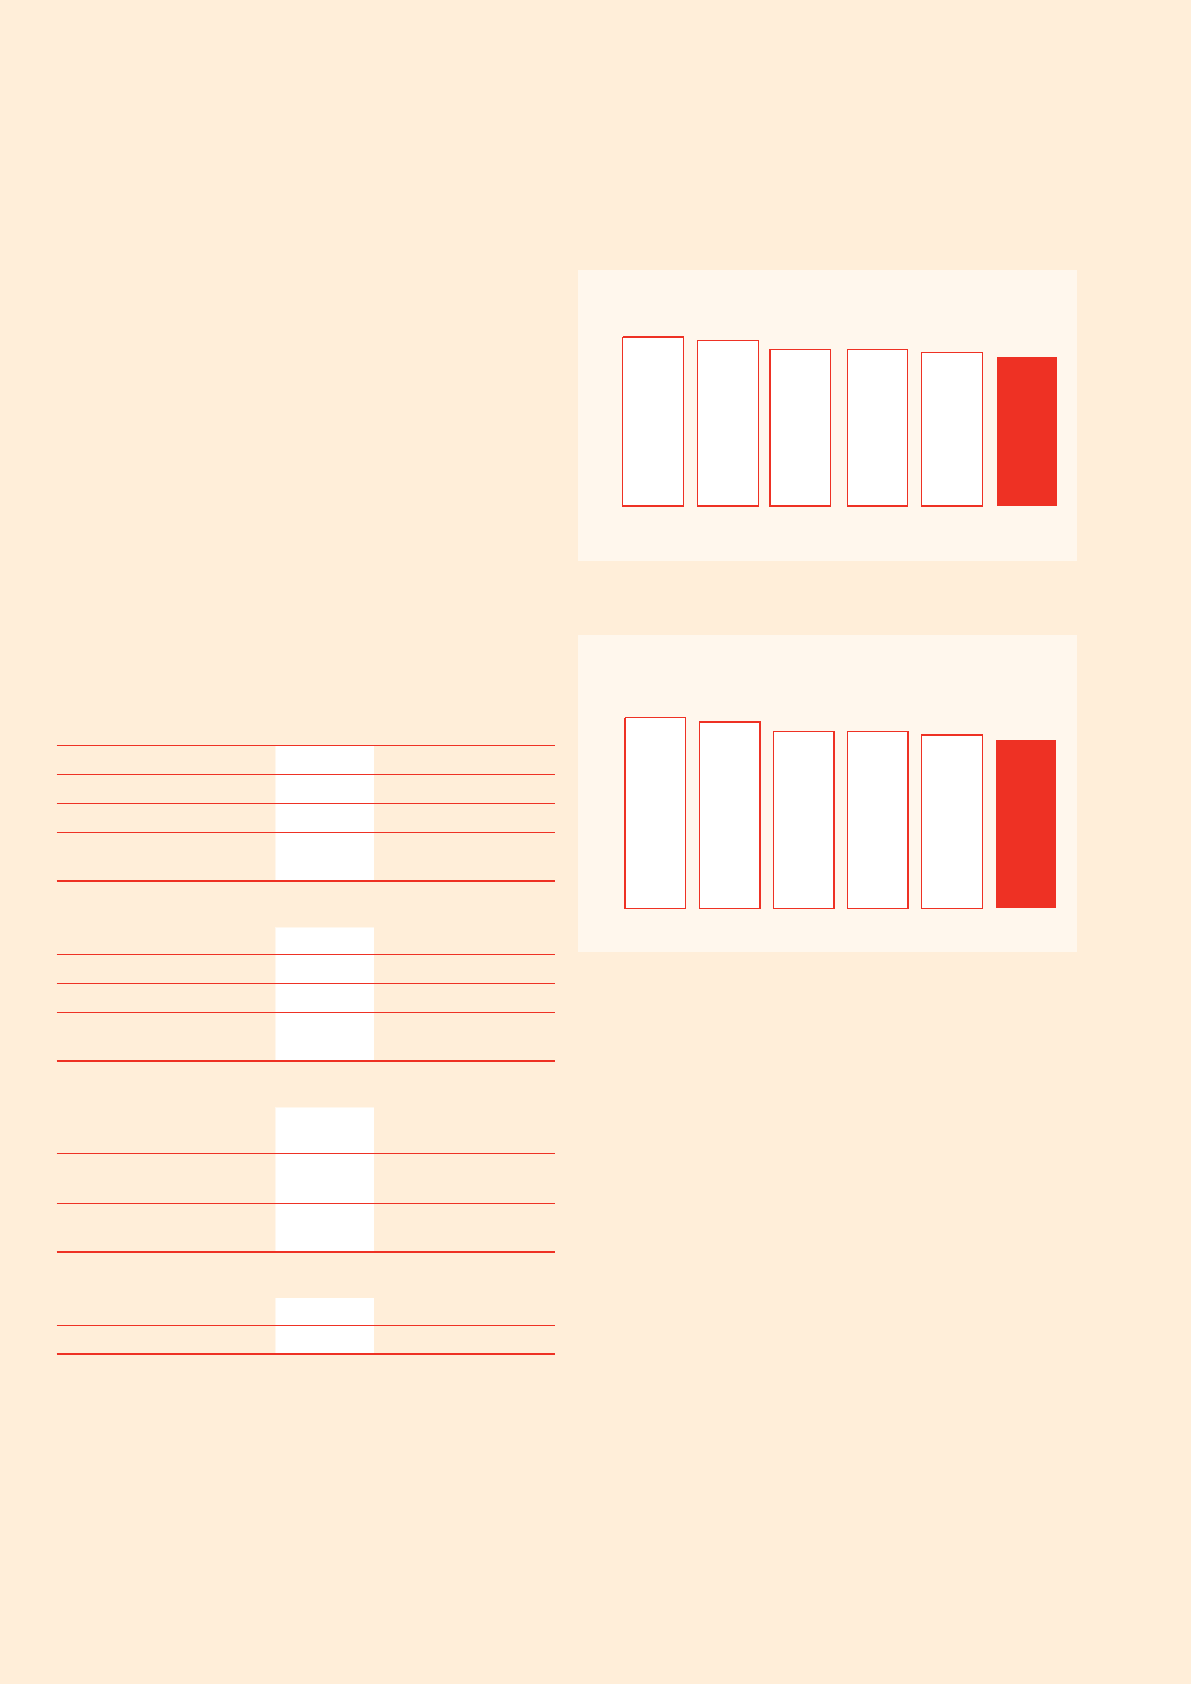
The following graph shows continuous improvement in Qantas Airline’s
fuel efficiency over the last three years:
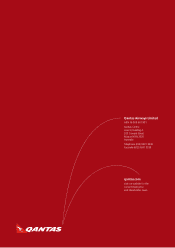
The following graph shows continuous improvement in Qantas Airline’s
CO2 efficiency over the last three years:
Economic Contribution
The Qantas Group makes a significant economic and social contribution
to the Australian community by transporting both people and freight.
Australia is to most of the world, a long-haul destination, for which air is
the most utilised form of transport. Australia is reliant on air transport to
support business, time sensitive freight and importantly, the tourism
industry. Qantas is the most significant non-government contributor to
Australian tourism. Tourism creates jobs for half a million Australians and is
worth $81 billion to the country. Qantas’ primary focus is on Australian
tourism rather than making Australia an ancillary stop on the way to
building passenger volumes through another destination.
A country with the size and geographic dispersion of Australia is reliant on
air transport to efficiently connect its citizens to each other and to the
world. In addition, Qantas provides the infrastructure to bring tourists and
business to Australia and to distribute them around the country. As at
30 June 2007, Qantas Group airlines operate more than 700 international
services each week and fly to 85 international destinations (including those
operated by codeshare partners) in 38 countries, including Australia.
Domestically, the Qantas Group operates more than 5,000 flights each
week to 55 city and regional destinations in all Australian states and
mainland territories. Qantas also operates more than 200 domestic flights
each week within New Zealand.
Qantas Airline’s Aviation Fuel Efficiency (Litres per 100 RTKs)
Qantas Airline’s Aviation CO2 Efficiency (Kgs per 100 RTKs)
136 Qantas |Annual Report 2007
0
20
40
60
80
100
106.7
2002
104.4
2003
99.1
2004
99.1
2005
97.1
2006
94.4
2007
0
5
10
15
20
25
30
35
40
45 43.4
2002
42.5
2003
40.3
2004
40.3
2005
39.5
2006
38.4
2007