Qantas 2007 Annual Report Download - page 94
Download and view the complete annual report
Please find page 94 of the 2007 Qantas annual report below. You can navigate through the pages in the report by either clicking on the pages listed below, or by using the keyword search tool below to find specific information within the annual report.-
 1
1 -
2
-
3
-
4
-
5
-
6
-
7
-
8
-
9
-
10
-
11
-
12
-
13
-
14
-
15
-
16
-
17
-
18
-
19
-
20
-
21
-
22
-
23
-
24
-
25
-
26
-
27
-
28
-
29
-
30
-
31
-
32
-
33
-
34
-
35
-
36
-
37
-
38
-
39
-
40
-
41
-
42
-
43
-
44
-
45
-
46
-
47
-
48
-
49
-
50
-
51
-
52
-
53
-
54
-
55
-
56
-
57
-
58
-
59
-
60
-
61
-
62
-
63
-
64
-
65
-
66
-
67
-
68
-
69
-
70
-
71
-
72
-
73
-
74
-
75
-
76
-
77
-
78
-
79
-
80
-
81
-
82
-
83
-
 84
84 -
 85
85 -
 86
86 -
 87
87 -
 88
88 -
 89
89 -
 90
90 -
 91
91 -
 92
92 -
 93
93 -
 94
94 -
 95
95 -
 96
96 -
 97
97 -
 98
98 -
 99
99 -
 100
100 -
 101
101 -
 102
102 -
 103
103 -
 104
104 -
105
-
106
-
107
-
108
-
109
-
110
-
111
-
112
-
113
-
114
-
115
-
116
-
117
-
118
-
119
-
120
-
121
-
122
-
123
-
124
-
125
-
126
-
127
-
128
-
129
-
130
-
131
-
132
-
133
-
134
-
135
-
136
-
137
-
138
-
139
-
140
-
141
-
142
-
143
-
144
 |
 |
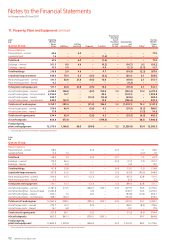
92 Qantas |Annual Report 2007
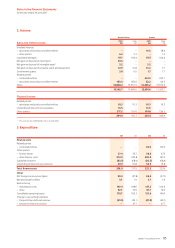
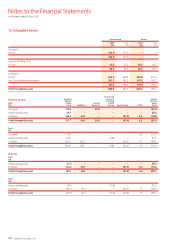
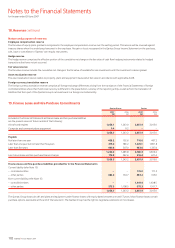
2007
$M
Qantas Group
Opening
Written
Down
Value Additions
Entities
Acquired Disposals Transfers
Transferred
from/(to)
Assets
Classified
as Held
for Sale
Depreciation
and
Amortisation Other1
Closing
Written
Down
Value
Reconciliations
Freehold land – owned 65.6–6.3––– ––71.9
Leasehold land 1.6 – – – (1.6) – – – –
Total land 67.2 – 6.3 – (1.6) – – – 71.9
Buildings – owned 201.3 4.0 4.6 – (0.2) – (14.7) 0.2 195.2
Buildings – leased 15.5 1.0 – – 0.9 – (2.2) (2.5) 12.7
Total buildings 216.8 5.0 4.6 – 0.7 – (16.9) (2.3) 207.9
Leasehold improvements 548.4 76.4 0.3 (0.3) (3.2) – (64.1) 6.1 563.6
Plant and equipment – owned 511.5 63.8 27.8 (9.5) 13.4 – (97.0) 2.1 512.1
Plant and equipment – leased 0.2–––––(0.2)––
Total plant and equipment 511.7 63.8 27.8 (9.5) 13.4 – (97.2) 2.1 512.1
Aircraft and engines – owned 6,793.0 146.8 – (8.7) 155.9 1.3 (724.2) 13.2 6,377.3
Aircraft and engines – hire purchased 2,052.0 12.7 – – 30.2 – (101.1) – 1,993.8
Aircraft and engines – leased 494.7 – – (12.3) (12.6) – (69.6) – 400.2
Aircraft and engines – maintenance 430.0 123.9 – – 12.5 – (196.2) – 370.2
Total aircraft and engines 9,769.7 283.4 – (21.0) 186.0 1.3 (1,091.1) 13.2 9,141.5
Aircraft spare parts – owned 376.6 65.4 – (3.6) 4.3 – (51.5) (3.2) 388.0
Aircraft spare parts – leased 17.8––––– –(3.3)14.5
Total aircraft spare parts 394.4 65.4 – (3.6) 4.3 – (51.5) (6.5) 402.5
Aircraft deposits 866.8 672.8 – – (199.6) – – 68.8 1,408.8
Total property,
plant and equipment 12,375.0 1,166.8 39.0 (34.4) – 1.3 (1,320.8) 81.4 12,308.3
Other includes transfers to inventories and capitalised interest.1
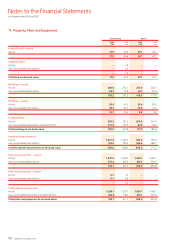
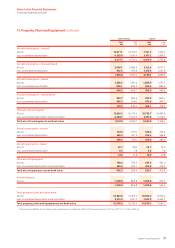
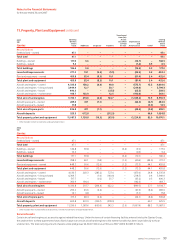
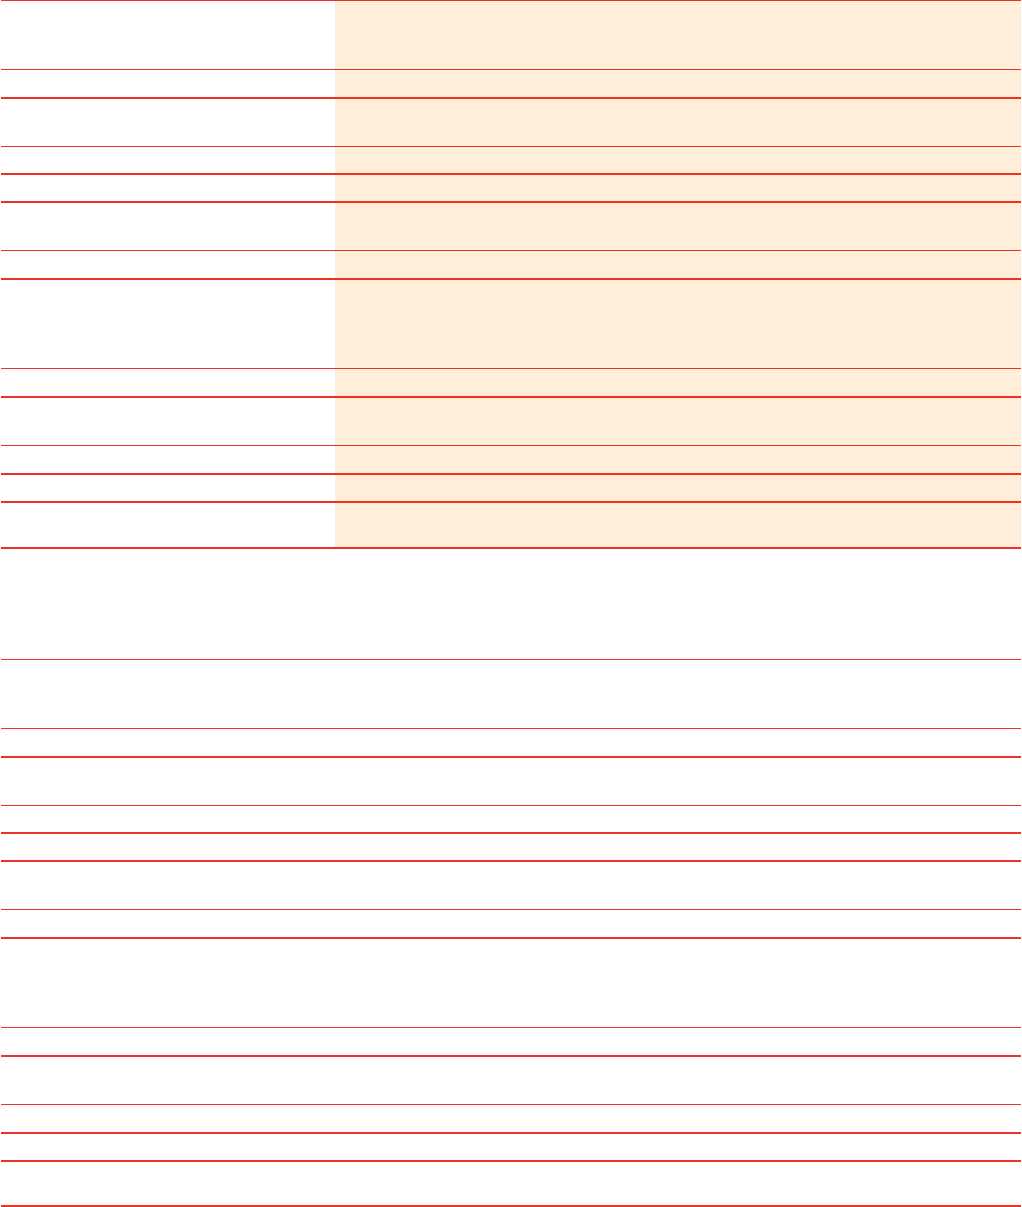
11. Property, Plant and Equipment continued
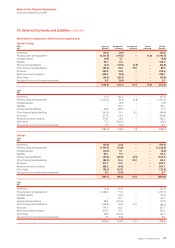
2006
$M
Qantas Group
Reconciliations
Freehold land – owned 68.0 – – (0.4) – (3.7) – 1.7 65.6
Leasehold land 0.4 1.4 – – – – – (0.2) 1.6
Total land 68.4 1.4 – (0.4) – (3.7) – 1.5 67.2
Buildings – owned 174.4 40.3 – – – (0.4) (11.7) (1.3) 201.3
Buildings – leased 17.4 (0.5) – – – – (1.4) – 15.5
Total buildings 191.8 39.8 – – – (0.4) (13.1) (1.3) 216.8
Leasehold improvements 597.8 61.0 – (0.7) – (1.3) (63.4) (45.0) 548.4
Plant and equipment – owned 509.6 61.3 – (13.3) (1.2) (87.7) 42.8 511.5
Plant and equipment – leased 0.5 – – – – – (0.3) – 0.2
Total plant and equipment 510.1 61.3 – (13.3) – (1.2) (88.0) 42.8 511.7
Aircraft and engines – owned 6,787.6 213.5 – (284.7) 550.1 (2.6) (527.5) 56.6 6,793.0
Aircraft and engines – hire purchased 2,240.8 – – (1.0) – – (218.7) 30.9 2,052.0
Aircraft and engines – leased 634.1 1.0 – (0.2) – – (82.8) (57.4) 494.7
Aircraft and engines – maintenance 398.1 194.4 – – – – (162.5) – 430.0
Total aircraft and engines 10,060.6 408.9 – (285.9) 550.1 (2.6) (991.5) 30.1 9,769.7
Aircraft spare parts – owned 376.7 61.3 – (5.0) – – (48.1) (8.3) 376.6
Aircraft spare parts – leased 16.1 4.8 – – – – (3.1) – 17.8
Total aircraft spare parts 392.8 66.1 – (5.0) – – (51.2) (8.3) 394.4
Aircraft deposits 863.0 843.3 – (359.1) (550.1) – – 69.7 866.8
Total property,
plant and equipment 12,684.5 1,481.8 – (664.4) – (9.2) (1,207.2) 89.5 12,375.0
Other includes the transitional effects of derivatives, transfers to inventories and capitalised interest.
1
Notes to the Financial Statements
for the year ended 30 June 2007