Qantas 2007 Annual Report Download - page 128
Download and view the complete annual report
Please find page 128 of the 2007 Qantas annual report below. You can navigate through the pages in the report by either clicking on the pages listed below, or by using the keyword search tool below to find specific information within the annual report.-
 1
1 -
2
-
3
-
4
-
5
-
6
-
7
-
8
-
9
-
10
-
11
-
12
-
13
-
14
-
15
-
16
-
17
-
18
-
19
-
20
-
21
-
22
-
23
-
24
-
25
-
26
-
27
-
28
-
29
-
30
-
31
-
32
-
33
-
34
-
35
-
36
-
37
-
38
-
39
-
40
-
41
-
42
-
43
-
44
-
45
-
46
-
47
-
48
-
49
-
50
-
51
-
52
-
53
-
54
-
55
-
56
-
57
-
58
-
59
-
60
-
61
-
62
-
63
-
64
-
65
-
66
-
67
-
68
-
69
-
70
-
71
-
72
-
73
-
74
-
75
-
76
-
77
-
78
-
79
-
80
-
81
-
82
-
83
-
84
-
85
-
86
-
87
-
88
-
89
-
90
-
91
-
92
-
93
-
94
-
95
-
96
-
97
-
98
-
99
-
100
-
101
-
102
-
103
-
104
-
105
-
106
-
107
-
108
-
109
-
110
-
111
-
112
-
113
-
114
-
115
-
116
-
117
-
 118
118 -
 119
119 -
 120
120 -
 121
121 -
 122
122 -
 123
123 -
 124
124 -
 125
125 -
 126
126 -
 127
127 -
 128
128 -
 129
129 -
 130
130 -
 131
131 -
 132
132 -
 133
133 -
 134
134 -
 135
135 -
 136
136 -
 137
137 -
 138
138 -
139
-
140
-
141
-
142
-
143
-
144
 |
 |

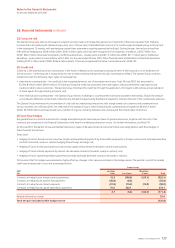
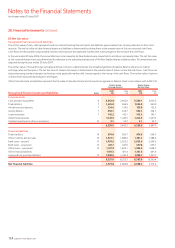
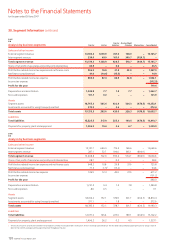
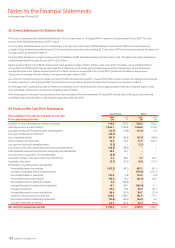
126 Qantas |Annual Report 2007
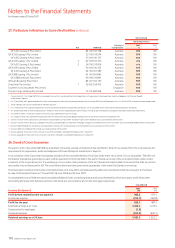
2007
$M
Analysis by business segments Qantas Jetstar
Qantas
Holidays
Qantas Flight
Catering Eliminations Consolidated
Sales and other income
External segment revenue 13,180.3 1,059.9 767.5 158.0 – 15,165.7
Inter-segment revenue 339.0 69.0 161.0 360.7 (929.7) –
Total segment revenue 13,519.3 1,128.9 928.5 518.7 (929.7) 15,165.7
Share of net profit of associates and jointly controlled entities 45.9 – 0.6 – – 46.5
Profit before related income tax expense and net finance costs 906.0 76.8 31.4 32.8 – 1,047.0
Net finance costs/(revenue) 41.0 (10.6) (15.5) – – 14.9
Profit before related income tax expense 865.0 87.4 46.9 32.8 – 1,032.1
Income tax expense (312.5)
Profit for the year 719.6
Depreciation and amortisation 1,345.9 7.7 1.4 7.7 – 1,362.7
Non-cash expenses 101.7 0.2 – – – 101.9
Assets
Segment assets 18,765.3 385.6 432.4 326.3 (676.5) 19,233.1
Investments accounted for using the equity method 370.0 – 2.6 – – 372.6
Total assets 19,135.3 385.6 435.0 326.3 (676.5) 19,605.7
Liabilities
Total liabilities 13,325.5 317.9 253.3 190.5 (676.5) 13,410.7
Payments for property, plant and equipment 1,206.0 19.6 3.6 6.7 – 1,235.9
2006
$M
Analysis by business segments
Sales and other income
External segment revenue 12,121.7 649.9 719.4 169.6 – 13,660.6
Inter-segment revenue 287.1 52.7 190.0 365.1 (894.9) –
Total segment revenue 12,408.8 702.6 909.4 534.7 (894.9) 13,660.6
Share of net profit of associates and jointly controlled entities 38.7 – 0.2 – – 38.9
Profit before related income tax expense and net finance costs 648.2 10.8 29.8 37.0 – 725.8
Net finance costs/(revenue) 71.3 (1.5)1(15.2) – – 54.6
Profit before related income tax expense 576.9 12.3 45.0 37.0 – 671.2
Income tax expense (191.2)
Profit for the year 480.0
Depreciation and amortisation 1,231.2 9.4 1.4 7.8 – 1,249.8
Non-cash expenses 8.6 0.5 – – – 9.1
Assets
Segment assets 18,414.2 152.1 376.9 301.7 (434.5) 18,810.4
Investments accounted for using the equity method 371.1 – 1.8 – – 372.9
Total assets 18,785.3 152.1 378.7 301.7 (434.5) 19,183.3
Liabilities
Total liabilities 12,977.2 145.4 225.0 189.1 (434.5) 13,102.2
Payments for property, plant and equipment 1,496.2 26.2 0.2 4.5 – 1,527.1
The results of Qantas and Jetstar have been restated by $1.5 million to include interest revenue on Jetstar’s working capital balance. This has been calculated by applying the Qantas Group’s cost of
debt to the monthly average working capital balance throughout the year.
1
30. Segment Information continued
Notes to the Financial Statements
for the year ended 30 June 2007