Qantas 2007 Annual Report Download - page 78
Download and view the complete annual report
Please find page 78 of the 2007 Qantas annual report below. You can navigate through the pages in the report by either clicking on the pages listed below, or by using the keyword search tool below to find specific information within the annual report.-
 1
1 -
2
-
3
-
4
-
5
-
6
-
7
-
8
-
9
-
10
-
11
-
12
-
13
-
14
-
15
-
16
-
17
-
18
-
19
-
20
-
21
-
22
-
23
-
24
-
25
-
26
-
27
-
28
-
29
-
30
-
31
-
32
-
33
-
34
-
35
-
36
-
37
-
38
-
39
-
40
-
41
-
42
-
43
-
44
-
45
-
46
-
47
-
48
-
49
-
50
-
51
-
52
-
53
-
54
-
55
-
56
-
57
-
58
-
59
-
60
-
61
-
62
-
63
-
64
-
65
-
66
-
67
-
 68
68 -
 69
69 -
 70
70 -
 71
71 -
 72
72 -
 73
73 -
 74
74 -
 75
75 -
 76
76 -
 77
77 -
 78
78 -
 79
79 -
 80
80 -
 81
81 -
 82
82 -
 83
83 -
 84
84 -
 85
85 -
 86
86 -
 87
87 -
 88
88 -
89
-
90
-
91
-
92
-
93
-
94
-
95
-
96
-
97
-
98
-
99
-
100
-
101
-
102
-
103
-
104
-
105
-
106
-
107
-
108
-
109
-
110
-
111
-
112
-
113
-
114
-
115
-
116
-
117
-
118
-
119
-
120
-
121
-
122
-
123
-
124
-
125
-
126
-
127
-
128
-
129
-
130
-
131
-
132
-
133
-
134
-
135
-
136
-
137
-
138
-
139
-
140
-
141
-
142
-
143
-
144
 |
 |

76 Qantas |Annual Report 2007
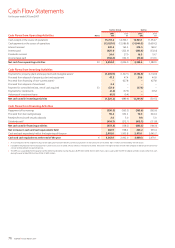
Cash Flow Statements
for the year ended 30 June 2007
Qantas Group Qantas
Cash Flows from Operating Activities Notes
2007
$M
2006
$M
2007
$M
2006
$M
Cash receipts in the course of operations 15,707.3 14,396.1 13,521.1 11,55 4.7
Cash payments in the course of operations (13,027.0) (12,086.8) (11,000.5) (9,699.2)
Interest received 230.2 165.3 212.5 148.2
Interest paid (425.1) (322.9) (353.6) (332.4)
Dividends received 34.4 37.0 16.5 19.7
Income taxes paid (166.4) (162.7) (70.4) (110.1)
Net cash from operating activities 33 2,353.4 2,026.0 2,325.6 1,580.9
Cash Flows from Investing Activities
Payments for property, plant and equipment and intangible assets1(1,235.9) (1,527.1) (1,193.9) (1,132.9)
Proceeds from disposal of property, plant and equipment 47.3 47.4 29.6 40.8
Proceeds from financing of non-current assets2–627.8 –627.8
Proceeds from disposal of investment 3.2 –––
Payment for controlled entities, net of cash acquired 33 (32.1) –(37.6) –
Payments for investments (2.2) (37.3) –(37.2)
Advances of investment loans (0.5) (0.4) ––
Net cash used in investing activities (1,220.2) (889.6) (1,201.9) (501.5)
Cash Flows from Financing Activities
Repayment of borrowings (356.2) (563.3) (363.6) (563.6)
Proceeds from borrowings/swaps 96.2 632.2 74.0 624.4
Receipts from aircraft security deposits 2.4 5.0 9.8 5.0
Dividends paid3(414.7) (212.1) (413.7) (211.8)
Net cash used in financing activities (672.3) (138.2) (693.5) (146.0)
Net increase in cash and cash equivalents held 460.9 998.2 430.2 933.4
Cash and cash equivalents held at the beginning of the year 2,902.0 1,903.8 2,979.1 2,045.7
Cash and cash equivalents at the end of the year 63,362.9 2,902.0 3,409.3 2,979.1
As a consequence of the assignment of purchase rights prior to aircraft delivery, contractual payments to manufacturers of nil (2006: $631.1 million) were settled by aircraft lessors.
Included in the proceeds from financing of non-current assets was nil (2006: $412.2 million) in relation to nil (2006: 19) aircraft. The rights to these aircraft were sold prior to delivery of the aircraft to
a lessor and leased back via operating lease.
The DRP was suspended after the payment of the 2006 final dividend. During the year, 28,991,867 (2006: 55,333,681) shares were issued under the DRP. Dividends settled in shares rather than cash
during the year totalled $99.0 million (2006: $189.9 million).
1
2
3