Qantas 2007 Annual Report Download - page 75
Download and view the complete annual report
Please find page 75 of the 2007 Qantas annual report below. You can navigate through the pages in the report by either clicking on the pages listed below, or by using the keyword search tool below to find specific information within the annual report.-
 1
1 -
2
-
3
-
4
-
5
-
6
-
7
-
8
-
9
-
10
-
11
-
12
-
13
-
14
-
15
-
16
-
17
-
18
-
19
-
20
-
21
-
22
-
23
-
24
-
25
-
26
-
27
-
28
-
29
-
30
-
31
-
32
-
33
-
34
-
35
-
36
-
37
-
38
-
39
-
40
-
41
-
42
-
43
-
44
-
45
-
46
-
47
-
48
-
49
-
50
-
51
-
52
-
53
-
54
-
55
-
56
-
57
-
58
-
59
-
60
-
61
-
62
-
63
-
64
-
 65
65 -
 66
66 -
 67
67 -
 68
68 -
 69
69 -
 70
70 -
 71
71 -
 72
72 -
 73
73 -
 74
74 -
 75
75 -
 76
76 -
 77
77 -
 78
78 -
 79
79 -
 80
80 -
 81
81 -
 82
82 -
 83
83 -
 84
84 -
 85
85 -
86
-
87
-
88
-
89
-
90
-
91
-
92
-
93
-
94
-
95
-
96
-
97
-
98
-
99
-
100
-
101
-
102
-
103
-
104
-
105
-
106
-
107
-
108
-
109
-
110
-
111
-
112
-
113
-
114
-
115
-
116
-
117
-
118
-
119
-
120
-
121
-
122
-
123
-
124
-
125
-
126
-
127
-
128
-
129
-
130
-
131
-
132
-
133
-
134
-
135
-
136
-
137
-
138
-
139
-
140
-
141
-
142
-
143
-
144
 |
 |
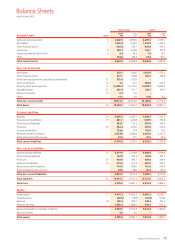
73Qantas |Annual Report 2007
Qantas Group Qantas
Current Assets Notes
2007
$M
2006
$M
2007
$M
2006
$M
Cash and cash equivalents 6 3,362.9 2,902.0 3,409.3 2,979.1
Receivables 71,376.8 1,124.3 1,214.0 1,194.2
Other financial assets 604.8 476.7 605.8 473.5
Inventories 8180.3 334.8 124.1 297.3
Assets classified as held for sale 9 5.4 24.2 1.8 14.7
Other 103.8 86.4 91.8 69.1
Total current assets 5,634.0 4,948.4 5,446.8 5,027.9
Non-current Assets
Receivables 7372.7 342.0 1,155.9 1,155.2
Other financial assets 537.7 766.8 537.7 766.8
Investments accounted for using the equity method 27 372.6 372.9 ––
Other investments 10 3.1 53.7 580.0 555.9
Property, plant and equipment 11 12,308.3 12,375.0 10,970.1 11,087.5
Intangible assets 12 365.9 311.7 233.1 199.7
Deferred tax assets 13 0.3 2.9 ––
Other 11.1 9.9 10.8 8.2
Total non-current assets 13,971.7 14,234.9 13,487.6 13,773.3
Total assets 30 19,605.7 19,183.3 18,934.4 18,801.2
Current Liabilities
Payables 14 2,005.7 1,985.3 1,938.3 1,799.5
Interest-bearing liabilities 15 863.7 440.8 1,187.9 723.8
Other financial liabilities 383.7 139.2 381.8 158.5
Provisions 16 534.4 469.0 470.0 410.0
Current tax liabilities 153.6 72.4 151.6 70.9
Revenue received in advance 2,533.6 2,282.8 2,267.4 2,107.5
Deferred lease benefits/income 29.3 37.5 25.5 33.6
Total current liabilities 6,504.0 5,427.0 6,422.5 5,303.8
Non-current Liabilities
Interest-bearing liabilities 15 4,210.9 5,334.8 4,648.4 5,818.8
Other financial liabilities 767.8 352.2 767.8 352.2
Provisions 16 481.9 479.7 439.8 439.9
Deferred tax liabilities 13 675.6 701.2 680.6 705.5
Revenue received in advance 701.5 708.5 701.5 708.5
Deferred lease benefits/income 69.0 98.8 60.4 86.0
Total non-current liabilities 6,906.7 7,675.2 7,298.5 8,110.9
Total liabilities 30 13,410.7 13,102.2 13,721.0 13,414.7
Net assets 6,195.0 6,081.1 5,213.4 5,386.5
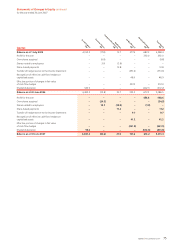
Equity
Issued capital 17 4,481.2 4,382.2 4,481.2 4,382.2
Treasury shares (32.6) (23.8) (32.6) (23.8)
Reserves 18 148.2 329.3 148.6 355.9
Retained earnings 1,592.3 1,388.5 616.2 672.2
Equity attributable to members of Qantas 6,189.1 6,076.2 5,213.4 5,386.5
Minority interest 5.9 4.9 ––
Total equity 6,195.0 6,081.1 5,213.4 5,386.5
Balance Sheets
as at 30 June 2007