Qantas 2007 Annual Report Download - page 76
Download and view the complete annual report
Please find page 76 of the 2007 Qantas annual report below. You can navigate through the pages in the report by either clicking on the pages listed below, or by using the keyword search tool below to find specific information within the annual report.-
 1
1 -
2
-
3
-
4
-
5
-
6
-
7
-
8
-
9
-
10
-
11
-
12
-
13
-
14
-
15
-
16
-
17
-
18
-
19
-
20
-
21
-
22
-
23
-
24
-
25
-
26
-
27
-
28
-
29
-
30
-
31
-
32
-
33
-
34
-
35
-
36
-
37
-
38
-
39
-
40
-
41
-
42
-
43
-
44
-
45
-
46
-
47
-
48
-
49
-
50
-
51
-
52
-
53
-
54
-
55
-
56
-
57
-
58
-
59
-
60
-
61
-
62
-
63
-
64
-
65
-
 66
66 -
 67
67 -
 68
68 -
 69
69 -
 70
70 -
 71
71 -
 72
72 -
 73
73 -
 74
74 -
 75
75 -
 76
76 -
 77
77 -
 78
78 -
 79
79 -
 80
80 -
 81
81 -
 82
82 -
 83
83 -
 84
84 -
 85
85 -
 86
86 -
87
-
88
-
89
-
90
-
91
-
92
-
93
-
94
-
95
-
96
-
97
-
98
-
99
-
100
-
101
-
102
-
103
-
104
-
105
-
106
-
107
-
108
-
109
-
110
-
111
-
112
-
113
-
114
-
115
-
116
-
117
-
118
-
119
-
120
-
121
-
122
-
123
-
124
-
125
-
126
-
127
-
128
-
129
-
130
-
131
-
132
-
133
-
134
-
135
-
136
-
137
-
138
-
139
-
140
-
141
-
142
-
143
-
144
 |
 |

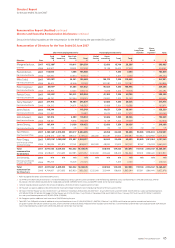
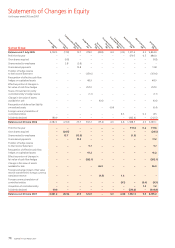
74 Qantas |Annual Report 2007
Statements of Changes in Equity
for the year ended 30 June 2007
Qantas Group
Balance as at 1 July 2005 4,192.3 (17.8) 13.7 379.0 (28.8) 4.4 (3.5) 1,311.4 4.2 5,854.9
Profit for the year – – – – – – – 479.5 0.5 480.0
Own shares acquired – (9.8) – – – – – – – (9.8)
Shares vested to employees – 3.8 (3.8) – – – – – – –
Share-based payments – – 13.8 – – – – – – 13.8
Transfer of hedge reserve
to the Income Statement – – – (351.6) – – – – – (351.6)
Recognition of effective cash flow
hedges on capitalised assets – – – 48.9 – – – – – 48.9
Effective portion of changes in
fair value of cash flow hedges – – – 257.0 – – – – – 257.0
Share of movement in jointly
controlled entity’s hedge reserve – – – (1.1) – – – – – (1.1)
Change in fair value of assets
available for sale – – – – (6.6) – – – – (6.6)
Recognition of deferred tax liability
on revalued assets – – – – – (0.4) – – – (0.4)
Foreign currency translation of
controlled entities – – – – – – 8.3 – 0.2 8.5
Dividends declared 189.9 – – – – – – (402.4) – (212.5)
Balance as at 30 June 2006 4,382.2 (23.8) 23.7 332.2 (35.4) 4.0 4.8 1,388.5 4.9 6,081.1
Profit for the year – – – – – – – 719.4 0.2 719.6
Own shares acquired –(24.5) – – – – – – –(24.5)
Shares vested to employees –15.7 (13.9) – – – – (1.8) – –
Share-based payments – – 17.2 – – – – – – 17.2
Transfer of hedge reserve
to the Income Statement – – – 9.7 – – – – – 9.7
Recognition of effective cash flow
hedges on capitalised assets –– –41.2–––––41.2
Effective portion of changes in
fair value of cash flow hedges – – – (263.1) – – – – – (263.1)
Change in fair value of assets
available for sale – – – – 36.9 – – – – 36.9
Foreign exchange impact of fair value
reserve transferred to foreign currency
translation reserve –– ––(1.5)–1.5–––
Foreign currency translation of
controlled entities –– ––––(9.1)–(0.4)(9.5)
Acquisition of controlled entity –– ––––––1.21.2
Dividends declared 99.0 – – – – – – (513.8) – (414.8)
Balance as at 30 June 2007 4,481.2 (32.6) 27.0 120.0 – 4.0 (2.8) 1,592.3 5.9 6,195.0
Issued Capital
$M
Treasury Shares
$M
Employee
Compensation Reserve
$M
Hedge Reserve
$M
Fair Value
Reserve
$M
Asset Revaluation
Reserve
$M
Foreign Currency
Translation Reserve
$M
Minority Interest
$M
Total Equity
$M
Retained Earnings
$M