Proctor and Gamble 2015 Annual Report Download - page 73
Download and view the complete annual report
Please find page 73 of the 2015 Proctor and Gamble annual report below. You can navigate through the pages in the report by either clicking on the pages listed below, or by using the keyword search tool below to find specific information within the annual report.-
 1
1 -
2
-
3
-
4
-
5
-
6
-
7
-
8
-
9
-
10
-
11
-
12
-
13
-
14
-
15
-
16
-
17
-
18
-
19
-
20
-
21
-
22
-
23
-
24
-
25
-
26
-
27
-
28
-
29
-
30
-
31
-
32
-
33
-
34
-
35
-
36
-
37
-
38
-
39
-
40
-
41
-
42
-
43
-
44
-
45
-
46
-
47
-
48
-
49
-
50
-
51
-
52
-
53
-
54
-
55
-
56
-
57
-
58
-
59
-
60
-
61
-
62
-
 63
63 -
 64
64 -
 65
65 -
 66
66 -
 67
67 -
 68
68 -
 69
69 -
 70
70 -
 71
71 -
 72
72 -
 73
73 -
 74
74 -
 75
75 -
 76
76 -
 77
77 -
 78
78 -
 79
79 -
 80
80 -
 81
81 -
 82
82 -
 83
83 -
84
-
85
-
86
-
87
-
88
 |
 |
71 The Procter & Gamble Company
Amounts in millions of dollars except per share amounts or as otherwise specified.
billion in an all-cash transaction. Under the terms of the
agreement, Mars acquired our branded pet care products, our
manufacturing sites in the United States and the majority of
the employees working in the Pet Care business. The
agreement included an option for Mars to acquire the Pet Care
business in several additional countries, which were
substantially completed as of June 30, 2015. The European
Union countries were not included in the agreement with Mars.
In December 2014, the Company completed the divestiture of
its Pet Care operations in estern Europe to Spectrum rands
in an all-cash transaction. Under the terms of the agreement,
Spectrum rands acquired our branded pet care products, our
manufacturing site in the Netherlands, and the majority of the
employees working in the estern Europe Pet Care business.
The one-time after-tax impact of these transactions is not
material.
The Pet Care business had historically been part of the
Companys Health Care reportable segment. In accordance
with applicable accounting guidance for the disposal of long-
lived assets, the results of the Pet Care business are presented
as discontinued operations and, as such, have been excluded
from both continuing operations and segment results for all
periods presented. Additionally, the Pet Care balance sheet
positions as of June 30, 2014 are presented as assets and
liabilities held for sale in the Consolidated alance Sheets.
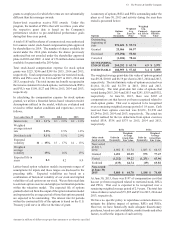
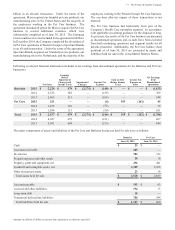
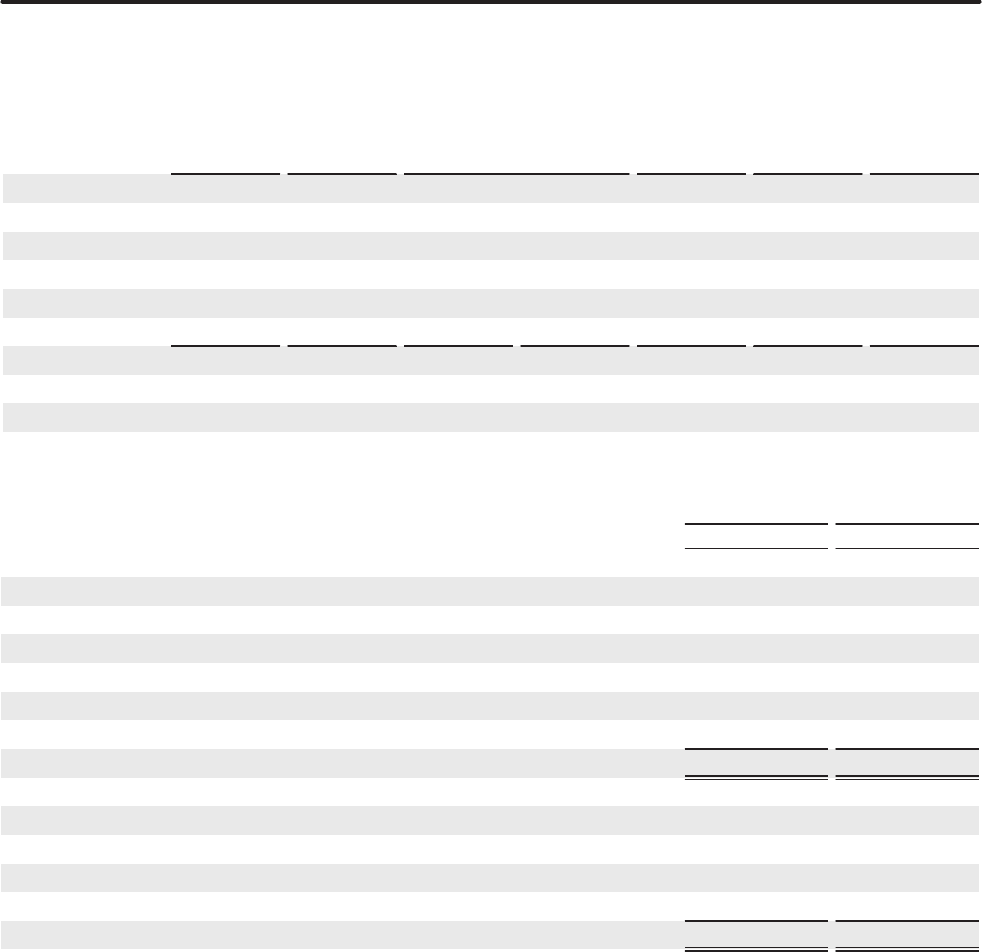
Following is selected financial information included in net earnings from discontinued operations for the atteries and Pet Care
businesses:
Net Sales
Earnings
Before
Imairment
Charges and
Income Taxes
Imairment
Charges
Income Tax
Exense
Gain on Sale
Before Income
Taxes
Income Tax
Exense on
Sales
Net Earnings
from
Discontinued
Oerations
Batteries 2015 2,22 49 2,14 140 1,5
2014 2,552 548 (159) 389
2013 2,465 513 (165) 348
Pet Care 2015 251 4 195 142 49
2014 1,475 130 (52) 78
2013 1,586 151 (50) 101
Total 2015 2,4 49 2,14 144 195 142 1,
2014 4,027 678 (211) 467
2013 4,051 664 (215) 449
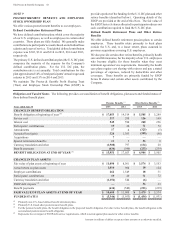
The major components of assets and liabilities of the Pet Care and atteries businesses held for sale were as follows:
Batteries Pet Care
une 0, 2015 une 0, 2014
Cash 25 $
Accounts receivable 245
Inventories 04 122
Prepaid expenses and other assets 2 14
Property, plant and equipment, net 49 441
Goodwill and intangible assets, net 2,9 2,258
Other noncurrent assets 2 14
Total assets held for sale ,510 $ 2,849
Accounts payable 195 $63
Accrued and other liabilities 194 13
Long-term debt 1
Noncurrent deferred tax liabilities 0 584
Total liabilities held for sale 1,1 $ 660