Proctor and Gamble 2015 Annual Report Download - page 24
Download and view the complete annual report
Please find page 24 of the 2015 Proctor and Gamble annual report below. You can navigate through the pages in the report by either clicking on the pages listed below, or by using the keyword search tool below to find specific information within the annual report.-
 1
1 -
2
-
3
-
4
-
5
-
6
-
7
-
8
-
9
-
10
-
11
-
12
-
13
-
 14
14 -
 15
15 -
 16
16 -
 17
17 -
 18
18 -
 19
19 -
 20
20 -
 21
21 -
 22
22 -
 23
23 -
 24
24 -
 25
25 -
 26
26 -
 27
27 -
 28
28 -
 29
29 -
 30
30 -
 31
31 -
 32
32 -
 33
33 -
 34
34 -
35
-
36
-
37
-
38
-
39
-
40
-
41
-
42
-
43
-
44
-
45
-
46
-
47
-
48
-
49
-
50
-
51
-
52
-
53
-
54
-
55
-
56
-
57
-
58
-
59
-
60
-
61
-
62
-
63
-
64
-
65
-
66
-
67
-
68
-
69
-
70
-
71
-
72
-
73
-
74
-
75
-
76
-
77
-
78
-
79
-
80
-
81
-
82
-
83
-
84
-
85
-
86
-
87
-
88
 |
 |

The Procter & Gamble Company 22
Item 7. Management's Discussion and Analysis of Financial Condition and Results of Operations.
Managements Discussion and Analsis
Forward-Looking Statements
Certain statements in this report, other than purely historical
information, including estimates, projections, statements
relating to our business plans, objectives and expected
operating results and the assumptions upon which those
statements are based, are forward-looking statements within
the meaning of the Private Securities Litigation Reform Act of
1995, Section 27A of the Securities Act of 1933 and
Section 21E of the Securities Exchange Act of 1934. Forward-
looking statements may appear throughout this report,
including, without limitation, in the following sections:
Management's Discussion and Analysis and Risk Factors.
These forward-looking statements generally are identified by
the words believe, project, expect, anticipate,
estimate, intend, strategy, future, opportunity,
plan, may, should, will, would, will be, will
continue, will likely result and similar expressions.
Forward-looking statements are based on current expectations
and assumptions that are subject to risks and uncertainties
which may cause actual results to differ materially from those
expressed or implied in the forward-looking statements. A
detailed discussion of risks and uncertainties that could cause
actual results and events to differ materially from such forward-
looking statements is included in the section titled Economic
Conditions and Uncertainties and the section titled Risk
Factors (Item 1A of this Form 10-K). Forward-looking
statements are made as of the date of this report, and we
undertake no obligation to update or revise publicly any
forward-looking statements, whether because of new
information, future events or otherwise.
The following Management's Discussion and Analysis
(MD&A) is intended to provide the reader with an
understanding of P&G's financial condition, results of
operations and cash flows by focusing on changes in certain
key measures from year to year. The MD&A is provided as a
supplement to, and should be read in conjunction with, our
Consolidated Financial Statements and accompanying Notes.
The MD&A is organized in the following sections:
Overview
Summary of 2015 Results
Economic Conditions and Uncertainties
Results of Operations
Segment Results
Cash Flow, Financial Condition and Liquidity
Significant Accounting Policies and Estimates
Other Information
Throughout the MD&A, we refer to measures used by
management to evaluate performance, including unit volume
growth, net sales and net earnings. e also refer to a number
of financial measures that are not defined under accounting
principles generally accepted in the United States of America
(U.S. GAAP), including organic sales growth, core earnings
per share (Core EPS), free cash flow, adjusted free cash flow
and adjusted free cash flow productivity. Organic sales growth
is net sales growth excluding the impacts of foreign exchange,
acquisitions and divestitures. Core EPS is diluted net earnings
per share from continuing operations excluding certain
specified charges and gains. Free cash flow is operating cash
flow less capital spending. Adjusted free cash flow is free cash
flow excluding tax payments for the Pet Care divestiture.
Adjusted free cash flow productivity is the ratio of adjusted
free cash flow to net earnings excluding impairment charges
on the atteries business and the enezuelan deconsolidation
charge. e believe these measures provide our investors with
additional information about our underlying results and trends,
as well as insight to some of the metrics used to evaluate
management. The explanation at the end of the MD&A
provides more details on the use and derivation of these
measures.
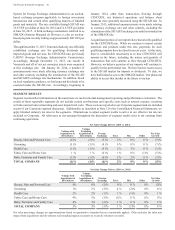
Management also uses certain market share and market
consumption estimates to evaluate performance relative to
competition despite some limitations on the availability and
comparability of share and consumption information.
References to market share and market consumption in the
MD&A are based on a combination of vendor-reported
consumption and market size data, as well as internal estimates.
All market share references represent the percentage of sales
in dollar terms on a constant currency basis of our products,
relative to all product sales in the category and are measured
on an annual basis versus the prior 12-month period.
References to competitive activity include promotional and
product initiatives from our competitors.
OVERVIEW
P&G is a global leader in fast-moving consumer goods,
focused on providing branded consumer packaged goods of
superior quality and value to our consumers around the world.
Our products are sold in more than 180 countries and territories
primarily through mass merchandisers, grocery stores,
membership club stores, drug stores, department stores, salons,
distributors, e-commerce, high-frequency stores and
pharmacies. e have on-the-ground operations in
approximately 70 countries.
Our market environment is highly competitive with global,
regional and local competitors. In many of the markets and
industry segments in which we sell our products, we compete
against other branded products as well as retailers' private-label
brands. Additionally, many of the product segments in which
we compete are differentiated by price tiers (referred to as
super-premium, premium, mid-tier and value-tier products).
e are well positioned in the industry segments and markets
in which we operate, often holding a leadership or significant
market share position.