Proctor and Gamble 2015 Annual Report Download - page 68
Download and view the complete annual report
Please find page 68 of the 2015 Proctor and Gamble annual report below. You can navigate through the pages in the report by either clicking on the pages listed below, or by using the keyword search tool below to find specific information within the annual report.-
 1
1 -
2
-
3
-
4
-
5
-
6
-
7
-
8
-
9
-
10
-
11
-
12
-
13
-
14
-
15
-
16
-
17
-
18
-
19
-
20
-
21
-
22
-
23
-
24
-
25
-
26
-
27
-
28
-
29
-
30
-
31
-
32
-
33
-
34
-
35
-
36
-
37
-
38
-
39
-
40
-
41
-
42
-
43
-
44
-
45
-
46
-
47
-
48
-
49
-
50
-
51
-
52
-
53
-
54
-
55
-
56
-
57
-
 58
58 -
 59
59 -
 60
60 -
 61
61 -
 62
62 -
 63
63 -
 64
64 -
 65
65 -
 66
66 -
 67
67 -
 68
68 -
 69
69 -
 70
70 -
 71
71 -
 72
72 -
 73
73 -
 74
74 -
 75
75 -
 76
76 -
 77
77 -
 78
78 -
79
-
80
-
81
-
82
-
83
-
84
-
85
-
86
-
87
-
88
 |
 |

The Procter & Gamble Company 66
Amounts in millions of dollars except per share amounts or as otherwise specified.
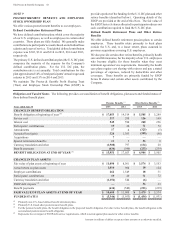
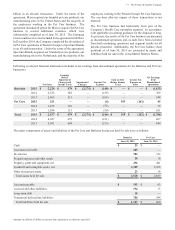
Total benefit payments expected to be paid to participants,
which include payments funded from the Company's assets
and payments from the plans are as follows:
Years ending une 0
Pension
Benefits
Other Retiree
Benefits
EXPECTED BENEFIT PAYMENTS
2016 $ 533 $ 182
2017 542 196
2018 560 210
2019 572 223
2020 587 235
2021 - 2025 3,403 1,334
Emloee Stock Ownershi Plan
e maintain the ESOP to provide funding for certain employee
benefits discussed in the preceding paragraphs.
The ESOPborrowed $1.0 billion in 1989 and the proceeds were
used to purchase Series A ESOP Convertible Class APreferred
Stock to fund a portion of the U.S. DC plan. Principal and
interest requirements of the borrowing were paid by the Trust
from dividends on the preferred shares and from advances
provided by the Company. The original borrowing of $1.0
billion has been repaid in full, and advances from the Company
of $86 remain outstanding at June 30, 2015. Each share is
convertible at the option of the holder into one share of the
Company's common stock. The dividend for the current year
was equal to the common stock dividend of $2.59 per share.
The liquidation value is $6.82 per share.
In 1991, the ESOP borrowed an additional $1.0 billion. The
proceeds were used to purchase Series ESOP Convertible
Class A Preferred Stock to fund a portion of retiree health care
benefits. These shares, net of the ESOP's debt, are considered
plan assets of the other retiree benefits plan discussed above.
Debt service requirements are funded by preferred stock
dividends, cash contributions and advances provided by the
Company, of which $662 is outstanding at June 30, 2015. Each
share is convertible at the option of the holder into one share
of the Company's common stock. The dividend for the current
year was equal to the common stock dividend of $2.59 per
share. The liquidation value is $12.96 per share.
Our ESOP accounting practices are consistent with current
ESOP accounting guidance, including the permissible
continuation of certain provisions from prior accounting
guidance. ESOP debt, which is guaranteed by the Company,
is recorded as debt (see Note 4) with an offset to the reserve
for ESOP debt retirement, which is presented within
shareholders' equity. Advances to the ESOP by the Company
are recorded as an increase in the reserve for ESOP debt
retirement. Interest incurred on the ESOP debt is recorded as
interest expense. Dividends on all preferred shares, net of
related tax benefits, are charged to retained earnings.
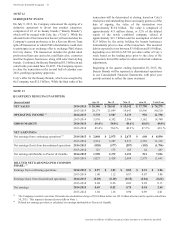
The series A and preferred shares of the ESOP are allocated
to employees based on debt service requirements. The number
of preferred shares outstanding at June 30 was as follows:
Shares in thousands 2015 2014 201
Allocated 42,044 44,465 45,535
Unallocated ,22 8,474 9,843
TOTAL SERIES A 49,22 52,939 55,378
Allocated 2,04 22,085 21,278
Unallocated 4,09 35,753 37,300
TOTAL SERIES B 5,10 57,838 58,578
For purposes of calculating diluted net earnings per common
share, the preferred shares held by the ESOP are considered
converted from inception.
INCOME TAXES
Income taxes are recognized for the amount of taxes payable
for the current year and for the impact of deferred tax assets
and liabilities, which represent future tax consequences of
events that have been recognized differently in the financial
statements than for tax purposes. Deferred tax assets and
liabilities are established using the enacted statutory tax rates
and are adjusted for any changes in such rates in the period of
change.
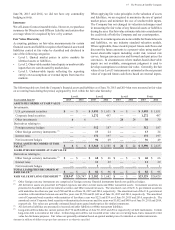
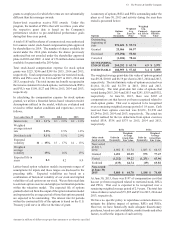
Earnings from continuing operations before income taxes
consisted of the following:
Years ended une 0 2015 2014 201
United States , $ 8,816 $ 8,020
International 2,9 5,521 6,159
TOTAL 11,4 $14,337 $ 14,179
Income taxes on continuing operations consisted of the
following:
Years ended une 0 2015 2014 201
CURRENT TAX EXPENSE
U.S. federal 2,22 $ 1,524 $ 1,745
International 1,195 1,301 1,502
U.S. state and local 252 237 278
,19 3,062 3,525
DEFERRED TAX EXPENSE
U.S. federal 11 142 185
International and other 192 (185) (484)
0 (43) (299)
TOTAL TAX EXPENSE 2,91 $ 3,019 $ 3,226