Proctor and Gamble 2015 Annual Report Download - page 27
Download and view the complete annual report
Please find page 27 of the 2015 Proctor and Gamble annual report below. You can navigate through the pages in the report by either clicking on the pages listed below, or by using the keyword search tool below to find specific information within the annual report.-
 1
1 -
2
-
3
-
4
-
5
-
6
-
7
-
8
-
9
-
10
-
11
-
12
-
13
-
14
-
15
-
16
-
 17
17 -
 18
18 -
 19
19 -
 20
20 -
 21
21 -
 22
22 -
 23
23 -
 24
24 -
 25
25 -
 26
26 -
 27
27 -
 28
28 -
 29
29 -
 30
30 -
 31
31 -
 32
32 -
 33
33 -
 34
34 -
 35
35 -
 36
36 -
 37
37 -
38
-
39
-
40
-
41
-
42
-
43
-
44
-
45
-
46
-
47
-
48
-
49
-
50
-
51
-
52
-
53
-
54
-
55
-
56
-
57
-
58
-
59
-
60
-
61
-
62
-
63
-
64
-
65
-
66
-
67
-
68
-
69
-
70
-
71
-
72
-
73
-
74
-
75
-
76
-
77
-
78
-
79
-
80
-
81
-
82
-
83
-
84
-
85
-
86
-
87
-
88
 |
 |

25 The Procter & Gamble Company
O-TSR performance is highly correlated with market total
shareholder returns. O-TSR is a balanced measure that requires
strong performance across the three primary drivers of value
creation: sales growth, profit margin expansion and efficient
utilization of assets to generate strong, reliable operating cash
flow. e operationalize O-TSR deep within the Company by
defining tight linkages between business activities and the key
drivers of value creation, from strategic choices of global
business units, brands and country teams down to individual
employees daily work plans.
The Company has recently undertaken an effort to focus and
strengthen its business portfolio to compete in categories and
brands that are structurally attractive and that play to P&G
strengths. This will enable us to allocate resources to leading
brands - marketed in the right set of countries, channels and
customers - where the size of the prize and probability of
winning is highest. hen the major portion of this work is
complete, we expect to compete in four industry-based sectors
made up of approximately ten product categories and 65
leading brands.
Innovation has always been - and continues to be - P&G's
lifeblood. To consistently win with consumers around the
world across price tiers and preferences and to consistently win
versus our best competitors, each P&G product category needs
a full portfolio of innovation, including a mix of commercial
programs, product improvements and game-changing
innovations. e are also innovating to improve our category,
brand and market business models to better serve consumers
and customers.
Productivity is a core strength for P&G, which creates
flexibility to fund our growth efforts, offset cost challenges
andor improve operating margins. e have taken significant
steps to accelerate productivity and savings across all elements
of costs, including cost of goods sold, marketing expense and
non-manufacturing overhead. These efforts are yielding
significant benefits to our operating margin.
Finally, we are focused on improving execution and operating
discipline in everything we do. Operating discipline and
execution have always been - and must continue to be - core
capabilities and competitive advantages for P&G.
The Company expects the delivery of the following long-term
annual financial targets will result in total shareholder returns
in the top third of the competitive peer group:
Organic sales growth above market growth rates in the
categories and geographies in which we compete
Core EPS growth of high single digits and
Adjusted free cash flow productivity of 90 or greater.
In periods with significant macroeconomic pressures, we will
maintain a disciplined approach to investing so as not to
sacrifice the long-term health of our businesses to meet short-
term objectives in any given year.
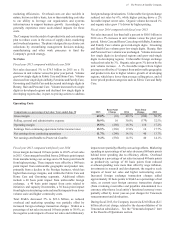
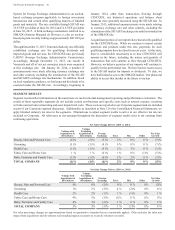
SUMMARY OF 2015 RESULTS
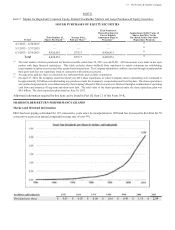
Amounts in millions, excet er share amounts 2015
Change s.
Prior Year 2014
Change s.
Prior Year 201
Net sales ,29 (5) $ 80,510 $ 80,116
Operating income 11,90 (20) 14,740 7 13,817
Net earnings from continuing operations ,90 (21) 11,318 3 10,953
Net earnings(loss) from discontinued operations 1,(482) 467 4 449
Net earnings attributable to Procter & Gamble ,0 (40) 11,643 3 11,312
Diluted net earnings per common share 2.44 (39) 4.01 4 3.86
Diluted net earnings per share from continuing operations .0 (21) 3.86 4 3.71
Core earnings per common share 4.02 (2) 4.09 5 3.89
Net sales decreased 5 to $76.3 billion including a
negative 6 impact from foreign exchange.
Organic sales increased 1.
Unit volume decreased 1. olume grew low single
digits in Fabric Care and Home Care. olume
decreased low single digits in aby, Feminine and
Family Care, Grooming and Health Care, and
declined mid-single digits in eauty, Hair and
Personal Care.
Net earnings from continuing operations decreased $2.4
billion or 21 due to a $2.1 billion after tax charge related
to the deconsolidation of our enezuelan subsidiaries and
the decline in net sales, partially offset by reduced selling,
general and administrative expenses (SG&A). Foreign
exchange impacts negatively affected net earnings by
approximately 12.
Net earnings from discontinued operations decreased $2.3
billion due primarily to impairment charges in our
atteries business, which is included in discontinued
operations due to the pending divestiture.
Net earnings attributable to Procter & Gamble were $7.0
billion, a decrease of $4.6 billion or 40 versus the prior
year period due primarily to the enezuelan
deconsolidation charge and impairment charges in our
atteries business.
Diluted net earnings per share decreased 39 to $2.44
Diluted net earnings per share from continuing
operations decreased 21 to $3.06.
Core EPS decreased 2 to $4.02.
Cash flow from operating activities was $14.6 billion.
Adjusted free cash flow was $11.6 billion.
Adjusted free cash flow productivity was 102.