Proctor and Gamble 2015 Annual Report Download - page 34
Download and view the complete annual report
Please find page 34 of the 2015 Proctor and Gamble annual report below. You can navigate through the pages in the report by either clicking on the pages listed below, or by using the keyword search tool below to find specific information within the annual report.-
 1
1 -
2
-
3
-
4
-
5
-
6
-
7
-
8
-
9
-
10
-
11
-
12
-
13
-
14
-
15
-
16
-
17
-
18
-
19
-
20
-
21
-
22
-
23
-
 24
24 -
 25
25 -
 26
26 -
 27
27 -
 28
28 -
 29
29 -
 30
30 -
 31
31 -
 32
32 -
 33
33 -
 34
34 -
 35
35 -
 36
36 -
 37
37 -
 38
38 -
 39
39 -
 40
40 -
 41
41 -
 42
42 -
 43
43 -
 44
44 -
45
-
46
-
47
-
48
-
49
-
50
-
51
-
52
-
53
-
54
-
55
-
56
-
57
-
58
-
59
-
60
-
61
-
62
-
63
-
64
-
65
-
66
-
67
-
68
-
69
-
70
-
71
-
72
-
73
-
74
-
75
-
76
-
77
-
78
-
79
-
80
-
81
-
82
-
83
-
84
-
85
-
86
-
87
-
88
 |
 |

The Procter & Gamble Company 32
product innovation and market growth. Global market
share of the electronic hair removal category was flat.
Net earnings decreased 9 to $1.8 billion due to the decline
in net sales and a 40 basis-point decrease in net earnings
margin. Net earnings margin decreased due to higher SG&A
spending as a percent of sales. Decreased spending due to
marketing efficiencies and overhead reductions did not keep
pace with the currency-driven reduction in net sales. Gross
margin was unchanged as negative geographic mix from a
disproportionate decline in developed regions was offset by
manufacturing cost savings.
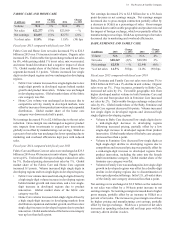
Fiscal year 2014 comparedwithfiscalyear 2013
Grooming net sales were flat at $8.0 billion in 2014 on a 1
increase in unit volume. Organic sales were up 3. Price
increases in lades and Razors and Appliances contributed 4
to net sales growth. Unfavorable geographic and product mix
reduced net sales by 2 due to disproportionate growth in
developing regions and mid-tier products, both of which have
lower than segment average selling prices. Unfavorable
foreign exchange reduced net sales by 3. Global market share
of the Grooming segment increased 0.2 points. olume
increased mid-single digits in developing regions partially
offset by a low-single-digit decrease in developed regions.
Shave Care volume increased low single digits due to a
mid-single-digit growth in developing regions from
innovation and market growth, partially offset by a low
single-digit decrease in developed regions due to market
contraction. Global market share of the blades and razors
category was up slightly.
olume in Appliances decreased low single digits due to
the sale of the raun household appliances business.
Organic volume increased mid-single digits driven by
developing markets due to market growth, product
innovation on men's shavers and shipments to build
inventory to support initiatives and new distributors.
Global market share of the appliances category was down
less than half a point.
Net earnings increased 6 to $2.0 billion due to a 150 basis-
point increase in net earnings margin. Net earnings margin
increased primarily due to a reduction in SG&A spending
which was driven by a decrease in marketing spending. Gross
margin increased slightly as the benefits of pricing and
manufacturing cost savings more than offset the negative
impacts of foreign exchange and geographic and product mix.
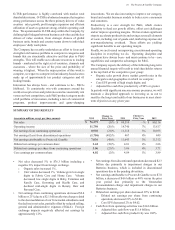
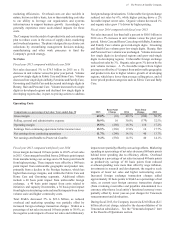
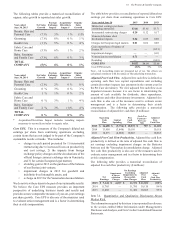
R
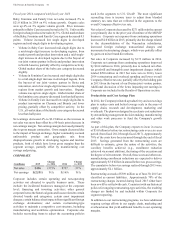
millions 2015
Change
s. 2014 2014
Change
s. 201
olume NA (1) NA 2
Net sales ,1 (1) $7,798 1
Net earnings 1,1 8 $1,083 (1)
of net sales 15.1 120 bps 13.9 (30) bps
Fiscal year 2015 comparedwithfiscalyear 2014
Health Care net sales declined 1 to $7.7 billion in 2015 on a
1 decline in unit volume. Organic sales increased 4.
Favorable geographic and product mix increased net sales 3,
primarily driven by Oral Care growth in developed markets,
which has higher average sales prices. Increased pricing added
2 to net sales. Unfavorable foreign exchange reduced net
sales by 5. Global market share of the Health Care segment
decreased 0.3 points. olume increased low single digits in
developed regions but decreased mid-single digits in
developing regions.
Oral Care volume decreased low single digits as a mid-
single-digit decline in developing regions due to
competitive activity and following increased pricing was
partially offset by a low single-digit increase in developed
regions from product innovation. Global market share of
the oral care category was flat.
olume in Personal Health Care decreased low single
digits due to a low single-digit decrease in developed
regions from competitive activity. olume in developing
markets was unchanged. Global market share of the
personal health care category was down about a point.
Net earnings increased 8 to $1.2 billion as the reduction in
net sales was more than offset by a 120-basis point increase in
net earnings margin. Net earnings margin increased due to
gross margin expansion and reduced SG&A spending as a
percentage of net sales. Gross margin increased primarily due
to the impact of higher pricing and manufacturing cost savings.
SG&A declined as a percentage of net sales due to a focus on
marketing spending efficiencies.
Fiscal year 2014 comparedwithfiscalyear 2013
Health Care net sales increased 1 to $7.8 billion in 2014 on
a 2 increase in unit volume. Organic sales increased 2.
Price increases across the businesses contributed 1 to net
sales growth. Disproportionate growth in developing regions
drove unfavorable geographic mix reducing net sales by 1.
Unfavorable foreign exchange reduced net sales by 1. Global
market share of the Health Care segment increased 0.2 points.
olume increased low single digits in both developed and
developing regions.
Oral Care volume increased low single digits due to a mid-
single-digit increase in developing regions behind
geographic market expansion and market growth and a
low single-digit increase in developed regions from
innovation. Global market share of the oral care category
increased less than half a point.
olume in Personal Health Care decreased low single
digits due to a weak cough and cold season which was
only partially offset by innovation and market expansion.
Net earnings decreased 1 to $1.1 billion as the increase in
net sales was more than offset by a 30-basis point decrease in
net earnings margin. Net earnings margin decreased due to
gross margin contraction, partially offset by lower overheads.
Gross margin decreased due to the impact of foreign exchange
and negative geographic and product mix, partially offset by
manufacturing cost savings and pricing.