Proctor and Gamble 2015 Annual Report Download - page 30
Download and view the complete annual report
Please find page 30 of the 2015 Proctor and Gamble annual report below. You can navigate through the pages in the report by either clicking on the pages listed below, or by using the keyword search tool below to find specific information within the annual report.-
 1
1 -
2
-
3
-
4
-
5
-
6
-
7
-
8
-
9
-
10
-
11
-
12
-
13
-
14
-
15
-
16
-
17
-
18
-
19
-
 20
20 -
 21
21 -
 22
22 -
 23
23 -
 24
24 -
 25
25 -
 26
26 -
 27
27 -
 28
28 -
 29
29 -
 30
30 -
 31
31 -
 32
32 -
 33
33 -
 34
34 -
 35
35 -
 36
36 -
 37
37 -
 38
38 -
 39
39 -
 40
40 -
41
-
42
-
43
-
44
-
45
-
46
-
47
-
48
-
49
-
50
-
51
-
52
-
53
-
54
-
55
-
56
-
57
-
58
-
59
-
60
-
61
-
62
-
63
-
64
-
65
-
66
-
67
-
68
-
69
-
70
-
71
-
72
-
73
-
74
-
75
-
76
-
77
-
78
-
79
-
80
-
81
-
82
-
83
-
84
-
85
-
86
-
87
-
88
 |
 |
The Procter & Gamble Company 28
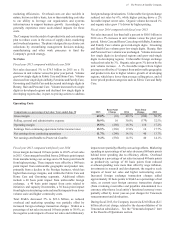
Fiscal year 2014 compared with fiscal year 2013
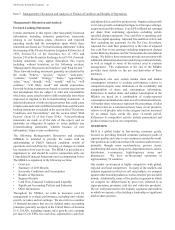
Gross margin contracted 100 basis points to 49.1 of net sales
in 2014. The decrease in gross margin was primarily driven
by a 150 basis point impact from unfavorable geographic and
product mix, a 50 basis point impact from higher commodity
costs and a 90 basis point impact from unfavorable foreign
exchange, partially offset by manufacturing cost savings of 190
basis points and a 40 basis point benefit from higher pricing.
The unfavorable geographic and product mix was caused by
disproportionate growth in developing regions and the Fabric
Care and Home Care and aby, Feminine and Family Care
segments, which have lower gross margins than the Company
average.
Total SG&A decreased 5 to $24.8 billion in 2014 due to a
reduction in marketing spending, overhead expense,
impairment charges and restructuring costs. SG&A as a
percentage of net sales decreased 170 basis points to 30.8.
Lower restructuring spending drove 30 basis points of the
decline. Marketing spending as a percentage of net sales
decreased 80 basis points primarily due to lower spending
behind a focus on more efficient marketing support and scale
benefits from increased net sales. Overhead spending
decreased 50 basis points from productivity savings.
Impairment charges were 40 basis points in 2013, but were
zero in 2014. Charges for the 2014 foreign currency policy
changes in enezuela were comparable to the 2013 enezuela
devaluation impact.
During fiscal 2013, we incurred impairment charges of $308
million ($290 million after tax) related to the carrying value
of goodwill in our Appliances business and the related raun
trade name intangible asset.
Non-Oerating Items
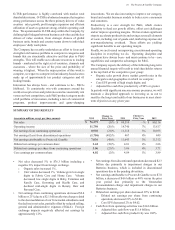
Fiscal year 2015 compared with fiscal year 2014
Interest expense was $626 million in 2015, a decrease of $84
million versus the prior year due to lower average debt balances
and a decrease in weighted average interest rates. Interest
income was $151 million in 2015, an increase of $50 million
versus the prior year due to an increase in cash, cash equivalents
and investment securities. Other non-operating income, net,
primarily includes divestiture gains and investment income.
Other non-operating income increased $325 million to $531
million, primarily due to minor brand divestiture gains. In
2015, we had approximately $400 million in minor brand
divestiture gains, including est, Camay, Fekkai and ash &
Go hair care brands, Rochas and Laura iagotti fine fragrance
brands and aposteam. The prior year acquisition and
divestiture activities included approximately $150 million in
divestiture gains, primarily related to the sale of our bleach
businesses in Europe, IMEA and Latin America, our Pert hair
care business in Latin America and MDIP.
Fiscal year 2014 compared with fiscal year 2013
Interest expense increased 6 in 2014 to $710 million,
primarily due to an increase in average debt outstanding.
Interest income was $101 million in 2014, an increase of $13
million versus the prior year due to an increase in cash, cash
equivalents and investment securities. Other non-operating
income, net, primarily includes divestiture gains and
investment income. Other non-operating income decreased
$735 million to $206 million, primarily due to acquisition and
divestiture impacts. In 2014, we had approximately $150
million in divestiture gains, primarily related to the sale of our
bleach businesses in Europe, IMEA and Latin America, our
Pert hair care business in Latin America and MDIP. The 2013
acquisition and divestiture activities included a $631 million
holding gain resulting from P&G's purchase of the balance of
its aby Care and Feminine Care joint venture in Iberia and
an approximate $250 million gain from the divestiture of our
Italy bleach business.
Income Taxes
Fiscal year 2015 compared with fiscal year 2014
The effective tax rate on continuing operations increased 350
basis points to 24.6 in 2015 mainly due to the non-
deductibility of the $2.0 billion enezuelan deconsolidation
charge. The rate increase caused by lower current year
favorable discrete adjustments related to uncertain income tax
positions (the net benefit was 80 basis points in the current year
versus 160 basis points in the prior year) was largely offset by
a decrease related to favorable geographic earnings mix.
Fiscal year 2014 compared with fiscal year 2013
The effective tax rate on continuing operations decreased 170
basis points to 21.1 in 2014. The primary driver of this rate
decline was approximately 320 basis points from the favorable
geographic mix of earnings and approximately 60 basis points
due to the non-deductibility of the 2013 impairment charges
related to our Appliances business. These impacts were
partially offset by a 50 basis point increase due to the enezuela
currency policy changes and devaluation discussed below
(which decreased the prior year rate 20 basis points and
increased the current year rate by 30 basis points), a 110 basis
point increase due to the tax impacts of acquisition and
divestiture activities (the gains from the purchase of the balance
of the aby Care and Feminine Care joint venture in Iberia and
the sale of our Italy bleach business in 2013) and a 30 basis
point increase due to the net impact of favorable discrete
adjustments related to uncertain income tax positions. The net
benefit 2014 was $228 million, or 160 basis points, versus 190
basis points of net benefit in 2013.
Net Earnings
Fiscal year 2015 compared with fiscal year 2014
Net earnings from continuing operations decreased $2.4 billion
or 21 to $8.9 billion due to the $2.1 billion after tax charge
related to the deconsolidation of enezuelan subsidiaries and
the decline in net sales, partially offset by reduced selling,
general and administrative costs (SG&A). Foreign exchange
impacts negatively affected net earnings by approximately
$1.4 billion in 2015 due to the weakening of certain key
currencies against the U.S. dollar, primarily in Russia, Ukraine,
enezuela and Argentina, partially offset by lower after-tax
charges related to balance sheet remeasurement charges in
enezuela.