Proctor and Gamble 2015 Annual Report Download - page 10
Download and view the complete annual report
Please find page 10 of the 2015 Proctor and Gamble annual report below. You can navigate through the pages in the report by either clicking on the pages listed below, or by using the keyword search tool below to find specific information within the annual report.-
 1
1 -
 2
2 -
 3
3 -
 4
4 -
 5
5 -
 6
6 -
 7
7 -
 8
8 -
 9
9 -
 10
10 -
 11
11 -
 12
12 -
 13
13 -
 14
14 -
 15
15 -
 16
16 -
 17
17 -
 18
18 -
 19
19 -
 20
20 -
 21
21 -
22
-
23
-
24
-
25
-
26
-
27
-
28
-
29
-
30
-
31
-
32
-
33
-
34
-
35
-
36
-
37
-
38
-
39
-
40
-
41
-
42
-
43
-
44
-
45
-
46
-
47
-
48
-
49
-
50
-
51
-
52
-
53
-
54
-
55
-
56
-
57
-
58
-
59
-
60
-
61
-
62
-
63
-
64
-
65
-
66
-
67
-
68
-
69
-
70
-
71
-
72
-
73
-
74
-
75
-
76
-
77
-
78
-
79
-
80
-
81
-
82
-
83
-
84
-
85
-
86
-
87
-
88
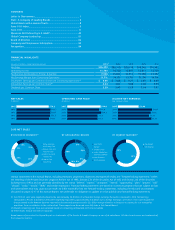
 |
 |
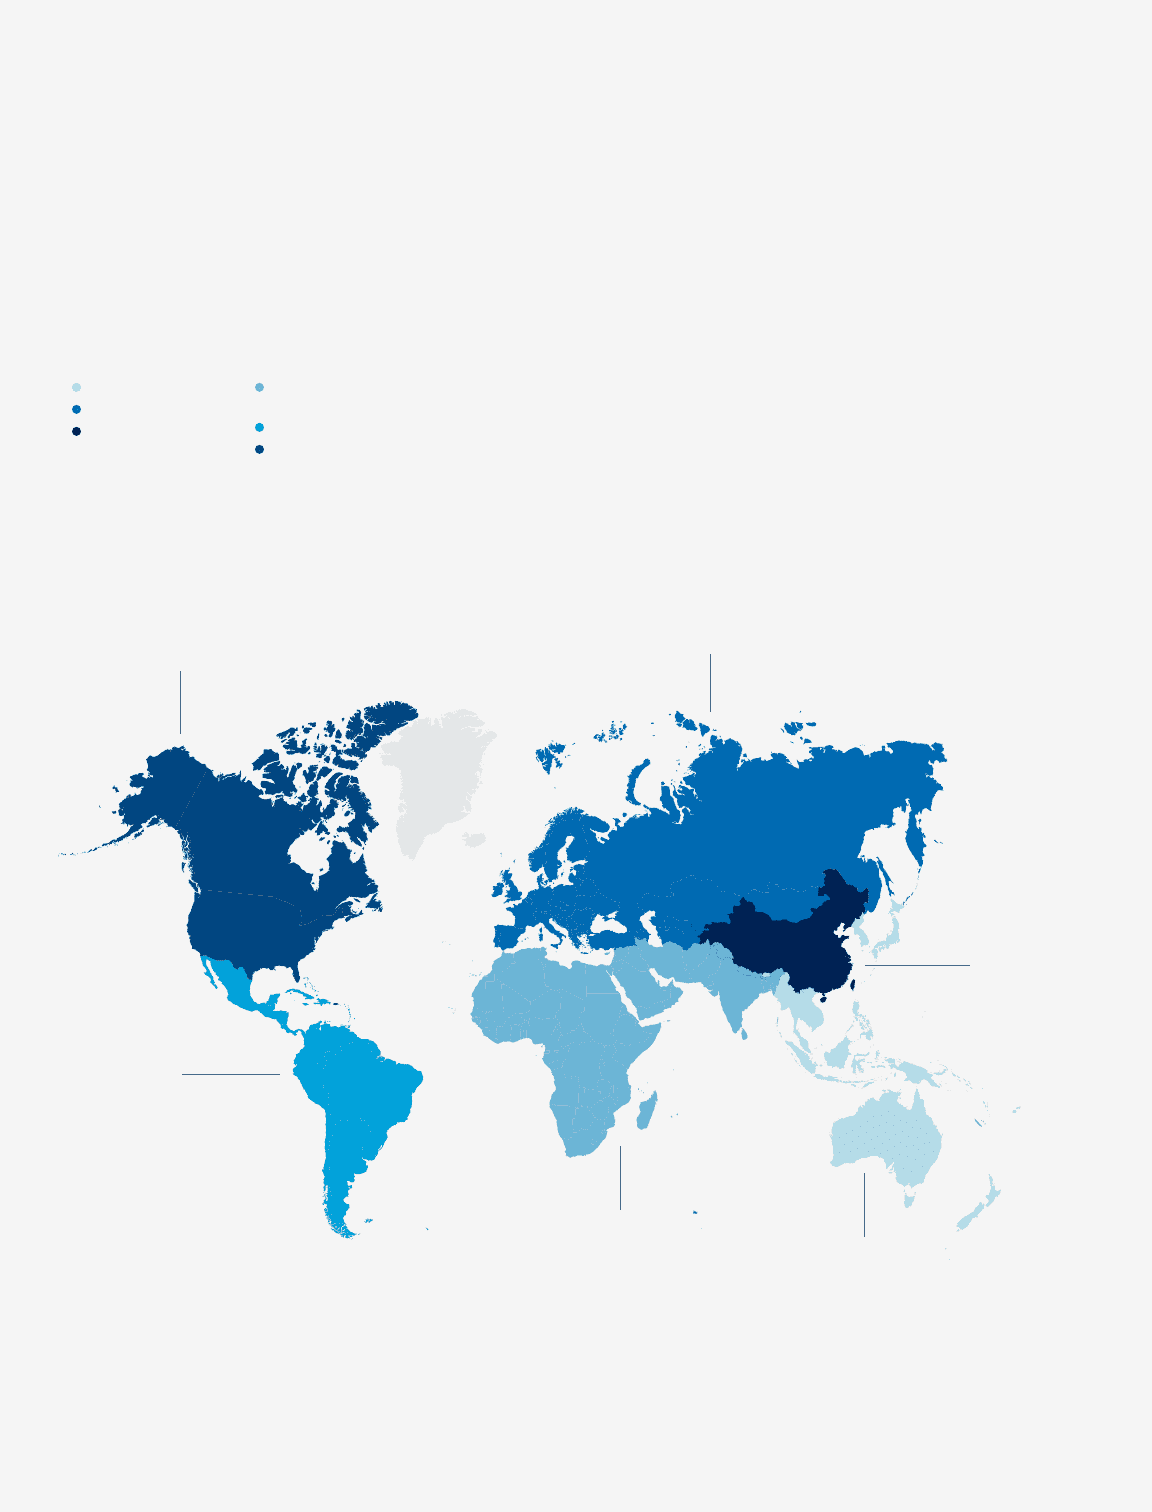
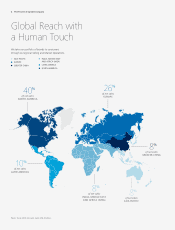
ASIA PACIFIC
EUROPE
GREATER CHINA
INDIA, MIDDLE EAST
AND AFRICA (IMEA)
LATIN AMERICA
NORTH AMERICA
We take our portfolio of brands to consumers
through six regional Selling and Market Operations.
Global Reach with
a Human Touch
of net sales
LATIN AMERICA
10%
of net sales
INDIA, MIDDLE EAST
AND AFRICA (IMEA)
8%
of net sales
ASIA PACIFIC
of net sales
EUROPE
26%
of net sales
NORTH AMERICA
40%
of net sales
GREATER CHINA
8%
P&G’s fiscal 2015 net sales were $76.3 billion.
8%
8 The Procter & Gamble Company