Proctor and Gamble 2015 Annual Report Download - page 38
Download and view the complete annual report
Please find page 38 of the 2015 Proctor and Gamble annual report below. You can navigate through the pages in the report by either clicking on the pages listed below, or by using the keyword search tool below to find specific information within the annual report.-
 1
1 -
2
-
3
-
4
-
5
-
6
-
7
-
8
-
9
-
10
-
11
-
12
-
13
-
14
-
15
-
16
-
17
-
18
-
19
-
20
-
21
-
22
-
23
-
24
-
25
-
26
-
27
-
 28
28 -
 29
29 -
 30
30 -
 31
31 -
 32
32 -
 33
33 -
 34
34 -
 35
35 -
 36
36 -
 37
37 -
 38
38 -
 39
39 -
 40
40 -
 41
41 -
 42
42 -
 43
43 -
 44
44 -
 45
45 -
 46
46 -
 47
47 -
 48
48 -
49
-
50
-
51
-
52
-
53
-
54
-
55
-
56
-
57
-
58
-
59
-
60
-
61
-
62
-
63
-
64
-
65
-
66
-
67
-
68
-
69
-
70
-
71
-
72
-
73
-
74
-
75
-
76
-
77
-
78
-
79
-
80
-
81
-
82
-
83
-
84
-
85
-
86
-
87
-
88
 |
 |
The Procter & Gamble Company 36
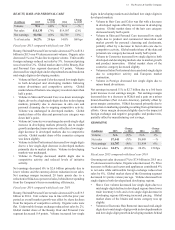
support capacity expansion, innovation and cost efficiencies,
were $3.7 billion in 2015 and $3.8 billion in 2014. Capital
spending as a percentage of net sales increased 10 basis points
to 4.9 in 2015. Capital spending as a percentage of net sales
in 2014 decreased 10 basis points versus 2013 to 4.8.
cstons Acquisition activity was not material in 2015 or
2014.
ocees om Dvesttes n te sset les Proceeds
from asset sales in 2015 contributed $4.5 billion in cash,
primarily from the sale of our Pet Care business, the sale of
our Chinese battery venture, and other minor brand
divestitures. Proceeds from asset sales contributed $570
million in cash in 2014 mainly due to minor brand divestiture
activities, including MDIP, the Pert business in Latin
America and the bleach business in Europe, IMEA and Latin
America.
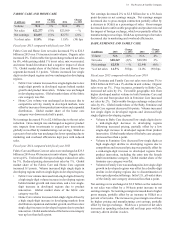
Financing Cash Flow
Dven ments Our first discretionary use of cash is
dividend payments. Dividends per common share increased
6 to $2.59 per share in 2015. Total dividend payments to
common and preferred shareholders were $7.3 billion in 2015
and $6.9 billion in 2014. In April 2015, the oard of Directors
declared an increase in our quarterly dividend from $0.6436
to $0.6629 per share on Common Stock and Series A and
ESOP Convertible Class A Preferred Stock. This represents a
3 increase compared to the prior quarterly dividend and is
the 59th consecutive year that our dividend has increased. e
have paid a dividend for 125 years, every year since our
incorporation in 1890.
onem n otem Det e maintain debt levels
we consider appropriate after evaluating a number of factors,
including cash flow expectations, cash requirements for
ongoing operations, investment and financing plans (including
acquisitions and share repurchase activities) and the overall
cost of capital. Total debt was $30.4 billion as of June 30, 2015
and $35.4 billion as of June 30, 2014. Our total debt decreased
in 2015 mainly due to debt maturities, partially offset by debt
issuances.
es cses Total share repurchases were $4.6 billion
in 2015 and $6.0 billion in 2014.
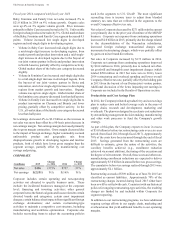
Liuidit
At June 30, 2015, our current liabilities exceeded current assets
by $144 million ($2.5 billion, excluding current assets and
current liabilities of the atteries business held for sale), largely
due to short-term borrowings under our commercial paper
program. e anticipate being able to support our short-term
liquidity and operating needs largely through cash generated
from operations. The Company regularly assesses its cash
needs and the available sources to fund these needs. As of June
30, 2015, $11.0 billion of the Companys cash, cash equivalents
and marketable securities is held off-shore by foreign
subsidiaries. Amounts held by foreign subsidiaries are
generally subject to U.S. income taxation on repatriation to the
U.S. e do not expect restrictions or taxes on repatriation of
cash held outside of the U.S. to have a material effect on our
overall liquidity, financial condition or the results of operations
for the foreseeable future. e utilize short- and long-term debt
to fund discretionary items, such as acquisitions and share
repurchases. e have strong short- and long-term debt ratings,
which have enabled and should continue to enable us to
refinance our debt as it becomes due at favorable rates in
commercial paper and bond markets. In addition, we have
agreements with a diverse group of financial institutions that,
if needed, should provide sufficient credit funding to meet
short-term financing requirements.
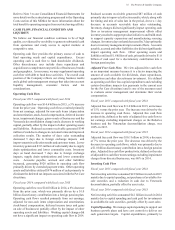
On June 30, 2015, our short-term credit ratings were P-1
(Moody's) and A-1 (Standard & Poor's), while our long-term
credit ratings are Aa3 (Moody's) and AA- (Standard & Poor's),
all with a stable outlook.
e maintain bank credit facilities to support our ongoing
commercial paper program. The current facility is an $11.0
billion facility split between a $7.0 billion five-year facility
and a $4.0 billion 364-day facility, which expire in August 2018
and July 2016, respectively. The 364-day facility can be
extended for certain periods of time as specified in the terms
of the credit agreement. These facilities are currently undrawn
and we anticipate that they will remain largely undrawn for the
foreseeable future. These credit facilities do not have cross-
default or ratings triggers, nor do they have material adverse
events clauses, except at the time of signing. In addition to
these credit facilities, we have an automatically effective
registration statement on Form S-3 filed with the SEC that is
available for registered offerings of short- or long-term debt
securities. For additional details on debt see Note 4.
Guarantees and Other Off-Balance Sheet Arrangements
e do not have guarantees or other off-balance sheet financing
arrangements, including variable interest entities, which we
believe could have a material impact on financial condition or
liquidity.