Proctor and Gamble 2015 Annual Report Download - page 43
Download and view the complete annual report
Please find page 43 of the 2015 Proctor and Gamble annual report below. You can navigate through the pages in the report by either clicking on the pages listed below, or by using the keyword search tool below to find specific information within the annual report.-
 1
1 -
2
-
3
-
4
-
5
-
6
-
7
-
8
-
9
-
10
-
11
-
12
-
13
-
14
-
15
-
16
-
17
-
18
-
19
-
20
-
21
-
22
-
23
-
24
-
25
-
26
-
27
-
28
-
29
-
30
-
31
-
32
-
 33
33 -
 34
34 -
 35
35 -
 36
36 -
 37
37 -
 38
38 -
 39
39 -
 40
40 -
 41
41 -
 42
42 -
 43
43 -
 44
44 -
 45
45 -
 46
46 -
 47
47 -
 48
48 -
 49
49 -
 50
50 -
 51
51 -
 52
52 -
 53
53 -
54
-
55
-
56
-
57
-
58
-
59
-
60
-
61
-
62
-
63
-
64
-
65
-
66
-
67
-
68
-
69
-
70
-
71
-
72
-
73
-
74
-
75
-
76
-
77
-
78
-
79
-
80
-
81
-
82
-
83
-
84
-
85
-
86
-
87
-
88
 |
 |

41 The Procter & Gamble Company
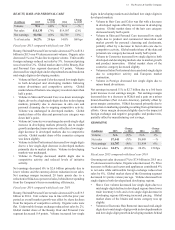
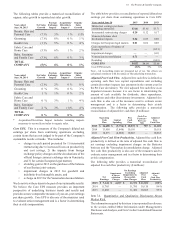
The following tables provide a numerical reconciliation of
organic sales growth to reported net sales growth:
Year ended
une 0, 2015
Net Sales
Growth
Foreign
Exchange
Imact
Acuisition
Diestiture
Imact
Organic
Sales
Growth
eauty, Hair and
Personal Care (7 ) 5 1 (1)
Grooming (7 ) 8 0 1
Health Care (1 ) 5 0 4
Fabric Care and
Home Care (5 ) 6 1 2
aby, Feminine
and Family Care (3 ) 6 0 3
TOTAL
COMPANY 5 0 1
Year ended
une 0, 2014
Net Sales
Growth
Foreign
Exchange
Imact
Acuisition
Diestiture
Imact
Organic
Sales
Growth
eauty, Hair and
Personal Care (2 ) 2 0 0
Grooming 0 3 0 3
Health Care 1 1 0 2
Fabric Care and
Home Care 0 3 1 4
aby, Feminine
and Family Care 2 3 (1) 4
TOTAL
COMPANY 0 0
AcquisitionDivestiture Impact includes rounding impacts
necessary to reconcile net sales to organic sales.
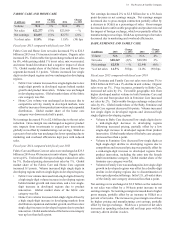
oe This is a measure of the Company's diluted net
earnings per share from continuing operations excluding
certain items that are not judged to be part of the Company's
sustainable results or trends. This includes:
charges in each period presented for 1) incremental
restructuring due to increased focus on productivity
and cost savings, 2) the impacts from foreign
exchange policy changes and the devaluations of the
official foreign currency exchange rate in enezuela,
and 3) for certain European legal matters
a holding gain in 2013 on the purchase of the balance
of our Iberian joint venture
impairment charges in 2013 for goodwill and
indefinite-lived intangible assets and
a charge in 2015 for the enezuelan deconsolidation.
e do not view these items to be part of our sustainable results.
e believe the Core EPS measure provides an important
perspective of underlying business trends and results and
provides a more comparable measure of year-on-year earnings
per share growth. Core EPS is also one of the measures used
to evaluate senior management and is a factor in determining
their at-risk compensation.
The table below provides a reconciliation of reported diluted net
earnings per share from continuing operations to Core EPS:
Years ended une 0 2015 2014 201
Diluted net earnings per share -
continuing operations .0 $3.86 $3.71
Incremental restructuring charges 0.20 0.12 0.17
enezuela balance sheet
devaluation impacts 0.04 0.09 0.08
Charges for European legal matters 0.01 0.02 0.05
Gain on purchase of balance of
Iberian J (0.21)
Impairment charges 0.10
enezuelan deconsolidation 0.1
Rounding (0.01)
CORE EPS 4.02 $4.09 $3.89
Core EPS Growth 2 5 6
Note - All reconciling items are presented net of tax. Tax effects are
calculated consistent with the nature of the underlying transaction.
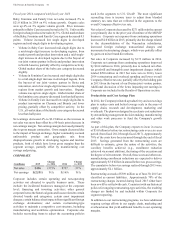
ste ee s lo Adjusted free cash flow is defined as
operating cash flow less capital expenditures and excluding
certain divestiture impacts (tax payments in the current year for
the Pet Care divestiture). e view adjusted free cash flow as an
important measure because it is one factor in determining the
amount of cash available for dividends, share repurchases,
acquisitions and other discretionary investments. Adjusted free
cash flow is also one of the measures used to evaluate senior
management and is a factor in determining their at-risk
compensation. The following table provides a numerical
reconciliation of adjusted free cash flow ($ millions):
Oerating
Cash
Flow
Caital
Sending
Free
Cash
Flow
Cash Tax
Pament -
Pet Care
Sale
Adusted
Free
Cash Flow
2015 14,0 , 10,2 29 11,01
2014 13,958 (3,848) 10,110 10,110
2013 14,873 (4,008) 10,865 10,865
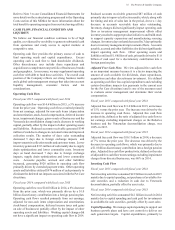
ste ee s lo octvt Adjusted free cash flow
productivity is defined as the ratio of adjusted free cash flow to
net earnings excluding impairment charges on the atteries
business and the enezuelan deconsolidation charge. Adjusted
free cash flow productivity is also one of the measures used to
evaluate senior management and is a factor in determining their
at-risk compensation.
The following table provides a numerical reconciliation of
adjusted free cash flow productivity ($ millions):
Net
Earnings
Imairment
& Decon-
solidation
Charges
Net Earnings
Excluding
Imairment &
Deconsolid-
ation Charges
Adusted
Free
Cash
Flow
Adusted
Free
Cash Flow
Productiit
2015 ,144 4,1 11,1 11,01 102
2014 11,785 11,785 10,110 86
2013 11,402 11,402 10,865 95
Item 7A. uantitative and ualitative Disclosures About
Market Risk.
The information required by this item is incorporated by reference
to the section entitled Other Information under Management's
Disclosure and Analysis, and Note 5 to the Consolidated Financial
Statements.