Proctor and Gamble 2015 Annual Report Download - page 15
Download and view the complete annual report
Please find page 15 of the 2015 Proctor and Gamble annual report below. You can navigate through the pages in the report by either clicking on the pages listed below, or by using the keyword search tool below to find specific information within the annual report.-
 1
1 -
2
-
3
-
4
-
 5
5 -
 6
6 -
 7
7 -
 8
8 -
 9
9 -
 10
10 -
 11
11 -
 12
12 -
 13
13 -
 14
14 -
 15
15 -
 16
16 -
 17
17 -
 18
18 -
 19
19 -
 20
20 -
 21
21 -
 22
22 -
 23
23 -
 24
24 -
 25
25 -
26
-
27
-
28
-
29
-
30
-
31
-
32
-
33
-
34
-
35
-
36
-
37
-
38
-
39
-
40
-
41
-
42
-
43
-
44
-
45
-
46
-
47
-
48
-
49
-
50
-
51
-
52
-
53
-
54
-
55
-
56
-
57
-
58
-
59
-
60
-
61
-
62
-
63
-
64
-
65
-
66
-
67
-
68
-
69
-
70
-
71
-
72
-
73
-
74
-
75
-
76
-
77
-
78
-
79
-
80
-
81
-
82
-
83
-
84
-
85
-
86
-
87
-
88
 |
 |

13 The Procter & Gamble Company
used to manufacture our products. The trademarks are
important to the overall marketing and branding of our
products. All major trademarks in each business are registered.
In part, our success can be attributed to the existence and
continued protection of these trademarks, patents and licenses.
Cometitie Condition. The markets in which our products
are sold are highly competitive. Our products compete against
similar products of many large and small companies, including
well-known global competitors. In many of the markets and
industry segments in which we sell our products we compete
against other branded products as well as retailers' private-label
brands. e are well positioned in the industry segments and
markets in which we operate, often holding a leadership or
significant market share position. e support our products
with advertising, promotions and other marketing vehicles to
build awareness and trial of our brands and products in
conjunction with an extensive sales force. e believe this
combination provides the most efficient method of marketing
for these types of products. Product quality, performance, value
and packaging are also important differentiating factors.
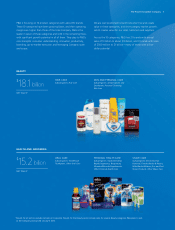
Research and Deeloment Exenditures. Research and
development expenditures enable us to develop technologies
and obtain patents across all categories in order to meet the
needs and improve the lives of our consumers. Total research
and development expenses were $2.0 billion in 2015 and 2014
and $1.9 billion in 2013.
Exenditures for Enironmental Comliance. Expenditures
for compliance with federal, state and local environmental laws
and regulations are fairly consistent from year to year and are
not material to the Company. No material change is expected
in fiscal year 2016.
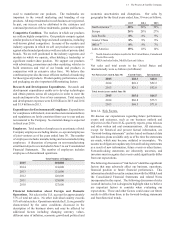
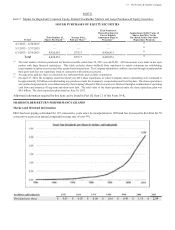
Emloees. Total number of employees is an estimate of total
Company employees excluding interns, co-ops and employees
of joint ventures as of the years ended June 30. The number
of employees includes manufacturing and non-manufacturing
employees. A discussion of progress on non-manufacturing
enrollment objectives is included in Note 3 to our Consolidated
Financial Statements. The number of employees includes
employees of discontinued operations.
Total Numer of Emloees
2015 110,000
2014 118,000
2013 121,000
2012 126,000
2011 129,000
2010 127,000
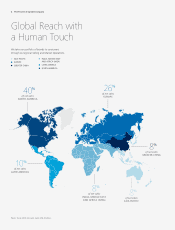
Financial Information aout Foreign and Domestic
Oerations. Net sales in the U.S. account for approximately
37 of total net sales. No other individual country exceeds
10 of total net sales. Operations outside the U.S. are generally
characterized by the same conditions discussed in the
description of the business above and may be affected by
additional factors including changing currency values,
different rates of inflation, economic growth and political and
economic uncertainties and disruptions. Our sales by
geography for the fiscal years ended June 30 were as follows:
2015 2014 201
North America (1) 40 38 39
Europe 2 28 27
Asia Pacific 8 9
Greater China 8 8
IMEA (2) 8 7
Latin America 10 10 10
(1) North America includes results for the United States, Canada and
Puerto Rico only.
(2) IMEA includes India, Middle East and Africa.
Net sales and total assets in the United States and
internationally were as follows (in billions):
Net Sales ears ended une 0 United States International
2015 2. 4.0
2014 $28.3 $52.2
2013 $28.1 $52.0
Total Assets ears ended une 0
2015 5.0 4.5
2014 $68.8 $75.5
2013 $68.3 $71.0
Item 1A. Risk Factors.
e discuss our expectations regarding future performance,
events and outcomes, such as our business outlook and
objectives in this Form 10-K, quarterly reports, press releases
and other written and oral communications. All statements,
except for historical and present factual information, are
forward-looking statements and are based on financial data
and business plans available only as of the time the statements
are made, which may become outdated or incomplete. e
assume no obligation to update any forward-looking statements
as a result of new information, future events or other factors.
Forward-looking statements are inherently uncertain, and
investors must recognize that events could significantly differ
from our expectations.
The following discussion of risk factors identifies significant
factors that may adversely affect our business, operations,
financial position or future financial performance. This
information should be read in conjunction with the MD&Aand
the Consolidated Financial Statements and related Notes
incorporated in this report. The following discussion of risks
is not all inclusive, but is designed to highlight what we believe
are important factors to consider when evaluating our
expectations. These and other factors could cause our future
results to differ from those in the forward-looking statements
and from historical trends.