Porsche 2006 Annual Report Download - page 174
Download and view the complete annual report
Please find page 174 of the 2006 Porsche annual report below. You can navigate through the pages in the report by either clicking on the pages listed below, or by using the keyword search tool below to find specific information within the annual report.-
 1
1 -
2
-
3
-
4
-
5
-
6
-
7
-
8
-
9
-
10
-
11
-
12
-
13
-
14
-
15
-
16
-
17
-
18
-
19
-
20
-
21
-
22
-
23
-
24
-
25
-
26
-
27
-
28
-
29
-
30
-
31
-
32
-
33
-
34
-
35
-
36
-
37
-
38
-
39
-
40
-
41
-
42
-
43
-
44
-
45
-
46
-
47
-
48
-
49
-
50
-
51
-
52
-
53
-
54
-
55
-
56
-
57
-
58
-
59
-
60
-
61
-
62
-
63
-
64
-
65
-
66
-
67
-
68
-
69
-
70
-
71
-
72
-
73
-
74
-
75
-
76
-
77
-
78
-
79
-
80
-
81
-
82
-
83
-
84
-
85
-
86
-
87
-
88
-
89
-
90
-
91
-
92
-
93
-
94
-
95
-
96
-
97
-
98
-
99
-
100
-
101
-
102
-
103
-
104
-
105
-
106
-
107
-
108
-
109
-
110
-
111
-
112
-
113
-
114
-
115
-
116
-
117
-
118
-
119
-
120
-
121
-
122
-
123
-
124
-
125
-
126
-
127
-
128
-
129
-
130
-
131
-
132
-
133
-
134
-
135
-
136
-
137
-
138
-
139
-
140
-
141
-
142
-
143
-
144
-
145
-
146
-
147
-
148
-
149
-
150
-
151
-
152
-
153
-
154
-
155
-
156
-
157
-
158
-
159
-
160
-
161
-
162
-
163
-
 164
164 -
 165
165 -
 166
166 -
 167
167 -
 168
168 -
 169
169 -
 170
170 -
 171
171 -
 172
172 -
 173
173 -
 174
174 -
 175
175 -
 176
176 -
 177
177 -
 178
178 -
 179
179 -
 180
180 -
 181
181 -
 182
182 -
 183
183 -
 184
184 -
185
-
186
-
187
-
188
-
189
-
190
 |
 |

172
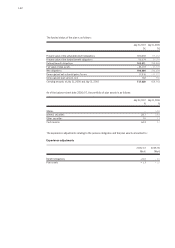
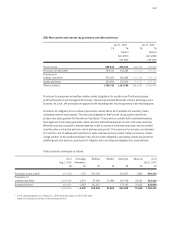
The adjustments of previous-year figures are contained in the following overviews:
Germany
2005/06 2005/06 2005/06
incl.
Amounts in millions of € adjustment adjustment
Third-party sales 2,187.1 – 2,187.1
Intersegment sales 4,074.7 – 4,074.7
Segment result from continuing operations 1,788.1 – 203.4 1,584.7
thereof share of profits and losses of entities accounted
for using the equity method 203.4 – 203.4 –
Segment result from discontinued operations 2.1 – 2.1
Segment assets 8,397.3 – 2,349.0 6,048.3
thereof investments in entities accounted for using
the equity method 3,263.7 – 3,263.7 –
Segment liabilities 5,769.0 1,014.5 6,783.5
Non-cash expenses 765.2 – 765.2
Amortization and depreciation 331.8 – 331.8
Capital expenditures (excluding financial assets) 437.0 – 437.0
Summary of adjustments to previous year segment information by region
Summary of adjustments to previous year segment information by business division
Rest of world
2005/06 2005/06 2005/06
incl.
Amounts in millions of € adjustment adjustment
Third-party sales 720.1 – 720.1
Intersegment sales 0.5 – 0.5
Segment result from continuing operations 37.0 – 37.0
thereof share of profits and losses of entities accounted
for using the equity method –––
Segment result from discontinued operations –––
Segment assets 260.4 – 260.4
thereof investments in entities accounted for using
the equity method –––
Segment liabilities 191.1 – 191.1
Non-cash expenses 0.8 – 0.8
Amortization and depreciation 2.3 – 2.3
Capital expenditures (excluding financial assets) 7.1 – 7.1
Vehicles
2005/06 2005/06 2005/06
incl.
Amounts in millions of € adjustment adjustment
Third-party sales 6,733.2 – 6,733.2
Intersegment sales 141.0 – 141.0
Segment assets 8,610.7 – 2,112.0 6,498.7
Capital expenditures (excluding financial assets) 399.7 – 399.7