Porsche 2006 Annual Report Download - page 162
Download and view the complete annual report
Please find page 162 of the 2006 Porsche annual report below. You can navigate through the pages in the report by either clicking on the pages listed below, or by using the keyword search tool below to find specific information within the annual report.-
 1
1 -
2
-
3
-
4
-
5
-
6
-
7
-
8
-
9
-
10
-
11
-
12
-
13
-
14
-
15
-
16
-
17
-
18
-
19
-
20
-
21
-
22
-
23
-
24
-
25
-
26
-
27
-
28
-
29
-
30
-
31
-
32
-
33
-
34
-
35
-
36
-
37
-
38
-
39
-
40
-
41
-
42
-
43
-
44
-
45
-
46
-
47
-
48
-
49
-
50
-
51
-
52
-
53
-
54
-
55
-
56
-
57
-
58
-
59
-
60
-
61
-
62
-
63
-
64
-
65
-
66
-
67
-
68
-
69
-
70
-
71
-
72
-
73
-
74
-
75
-
76
-
77
-
78
-
79
-
80
-
81
-
82
-
83
-
84
-
85
-
86
-
87
-
88
-
89
-
90
-
91
-
92
-
93
-
94
-
95
-
96
-
97
-
98
-
99
-
100
-
101
-
102
-
103
-
104
-
105
-
106
-
107
-
108
-
109
-
110
-
111
-
112
-
113
-
114
-
115
-
116
-
117
-
118
-
119
-
120
-
121
-
122
-
123
-
124
-
125
-
126
-
127
-
128
-
129
-
130
-
131
-
132
-
133
-
134
-
135
-
136
-
137
-
138
-
139
-
140
-
141
-
142
-
143
-
144
-
145
-
146
-
147
-
148
-
149
-
150
-
151
-
 152
152 -
 153
153 -
 154
154 -
 155
155 -
 156
156 -
 157
157 -
 158
158 -
 159
159 -
 160
160 -
 161
161 -
 162
162 -
 163
163 -
 164
164 -
 165
165 -
 166
166 -
 167
167 -
 168
168 -
 169
169 -
 170
170 -
 171
171 -
 172
172 -
173
-
174
-
175
-
176
-
177
-
178
-
179
-
180
-
181
-
182
-
183
-
184
-
185
-
186
-
187
-
188
-
189
-
190
 |
 |

160
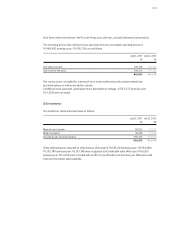
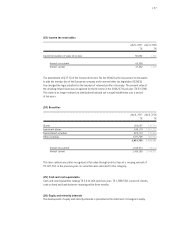
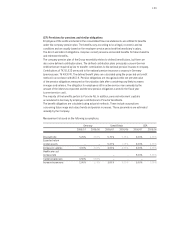
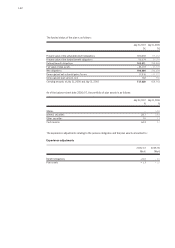
If the assumed healthcare cost increase rate increases or decreases by one percentage point,
the effects are as follows:
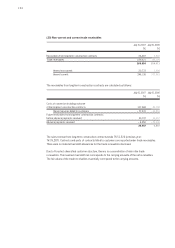
Amounts included in the income statement break down as follows:
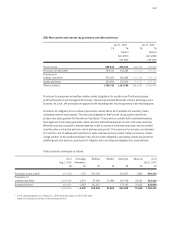
The expected rate of return on the asset classes contained in the plan assets is determined based
on the market prices prevailing on that date, applicable to the period over which the obligation is
to be settled.
The actual return on plan assets in the fiscal year amounted to T€ 3,747 (previous year: T€ 2,811).
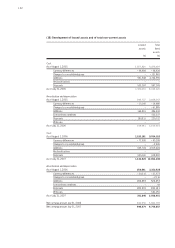
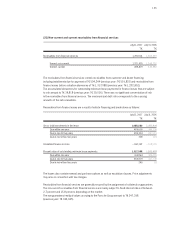
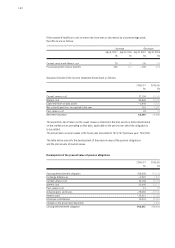
The table below presents the development of the present value of the pension obligations
and the plan assets at market values.
Development of the present value of pension obligations
2006/07 2005/06
T€ T€
Current service cost 32,194 39,143
Interest cost 33,660 30,172
Expected return on plan assets – 2,494 – 2,125
Net actuarial gain/loss recognized in the year 161 3,866
Past service cost 23 29
Net benefit expense 63,544 71,085
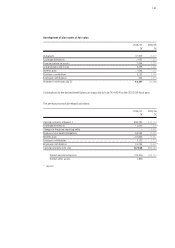
2006/07 2005/06
T€ T€
Opening defined benefit obligation 758,668 763,314
Exchange differences – 2,587 1,837
Current service cost 32,194 39,143
Interest cost 33,660 30,172
Past service cost 11 29
Actuarial gains and losses – 78,262 – 65,016
Benefits paid – 19,514 – 17,024
Employee contributions 19,501 13,055
Changes in the group reporting entity –– 6,842
Closing defined benefit obligation 743,671 758,668
Increase Decrease
July31,2007 July31, 2006 July31,2007 July31,2006
T€ T€ T€ T€
Current service and interest cost 25 28 – 26 – 30
Post-employment medical benefits 336 313 – 309 – 298