Porsche 2006 Annual Report Download - page 152
Download and view the complete annual report
Please find page 152 of the 2006 Porsche annual report below. You can navigate through the pages in the report by either clicking on the pages listed below, or by using the keyword search tool below to find specific information within the annual report.-
 1
1 -
2
-
3
-
4
-
5
-
6
-
7
-
8
-
9
-
10
-
11
-
12
-
13
-
14
-
15
-
16
-
17
-
18
-
19
-
20
-
21
-
22
-
23
-
24
-
25
-
26
-
27
-
28
-
29
-
30
-
31
-
32
-
33
-
34
-
35
-
36
-
37
-
38
-
39
-
40
-
41
-
42
-
43
-
44
-
45
-
46
-
47
-
48
-
49
-
50
-
51
-
52
-
53
-
54
-
55
-
56
-
57
-
58
-
59
-
60
-
61
-
62
-
63
-
64
-
65
-
66
-
67
-
68
-
69
-
70
-
71
-
72
-
73
-
74
-
75
-
76
-
77
-
78
-
79
-
80
-
81
-
82
-
83
-
84
-
85
-
86
-
87
-
88
-
89
-
90
-
91
-
92
-
93
-
94
-
95
-
96
-
97
-
98
-
99
-
100
-
101
-
102
-
103
-
104
-
105
-
106
-
107
-
108
-
109
-
110
-
111
-
112
-
113
-
114
-
115
-
116
-
117
-
118
-
119
-
120
-
121
-
122
-
123
-
124
-
125
-
126
-
127
-
128
-
129
-
130
-
131
-
132
-
133
-
134
-
135
-
136
-
137
-
138
-
139
-
140
-
141
-
 142
142 -
 143
143 -
 144
144 -
 145
145 -
 146
146 -
 147
147 -
 148
148 -
 149
149 -
 150
150 -
 151
151 -
 152
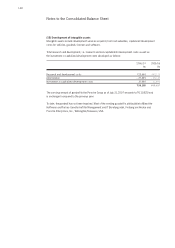
152 -
 153
153 -
 154
154 -
 155
155 -
 156
156 -
 157
157 -
 158
158 -
 159
159 -
 160
160 -
 161
161 -
 162
162 -
163
-
164
-
165
-
166
-
167
-
168
-
169
-
170
-
171
-
172
-
173
-
174
-
175
-
176
-
177
-
178
-
179
-
180
-
181
-
182
-
183
-
184
-
185
-
186
-
187
-
188
-
189
-
190
 |
 |

150
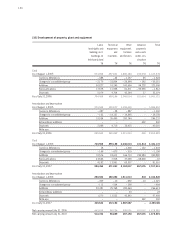
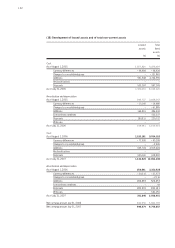
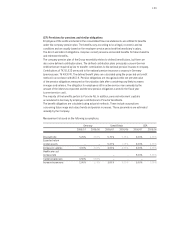
Land, Technical Other Advance Total
land rights and equipment equipment, payments
buildings incl. and
furniture
and assets
buildings on machines and fixtures under con-
third-party land struction
T€ T€ T€ T€ T€
Cost
As of August 1, 2005 673,898 457,601 1,896,384 100,056 3,127,939
Currency differences – 488 – 44 – 1,137 45 – 1,624
Changes to consolidated group – 2,175 – 23,854 – 28,894 – 292 – 55,215
Additions 50,827 18,249 160,654 94,228 323,958
Reclassifications 17,575 11,938 61,271 – 92,596 – 1,812
Disposals 5,079 4,704 42,264 27 52,074
As of July 31, 2006 734,558 459,186 2,046,014 101,414 3,341,172
Amortization and depreciation
As of August 1, 2005 274,544 352,877 1,359,436 – 1,986,857
Currency differences – 387 – 28 – 887 – – 1,302
Changes to consolidated group – 162 – 14,131 – 14,865 – – 29,158
Additions 19,034 26,459 200,744 – 246,237
Extraordinary additions – – – 402 402
Disposals 2,086 4,715 33,415 – 40,216
Write-ups – – – – –
As of July 31, 2006 290,943 360,462 1,511,013 402 2,162,820
Cost
As of August 1, 2006 734,558 459,186 2,046,014 101,414 3,341,172
Currency differences 18 1 – 1,300 – 122 – 1,403
Changes to consolidated group – 166 – 673 – 319 – – 1,158
Additions 70,576 18,612 166,710 234,984 490,882
Reclassifications 23,546 7,918 37,069 – 68,600 – 67
Disposals 4,182 13,991 63,337 – 81,510
As of July 31, 2007 824,350 471,053 2,184,837 267,676 3,747,916
Amortization and depreciation
As of August 1, 2006 290,943 360,462 1,511,013 402 2,162,820
Currency differences – 309 – 10 – 692 – 10 – 1,021
Changes to consolidated group – 112 – 534 – 258 – – 904
Additions 20,381 25,768 220,464 – 266,613
Extraordinary additions – – 23 – 23
Disposals 1,273 13,522 42,863 – 57,658
Write-ups – – – 392 392
As of July 31, 2007 309,630 372,164 1,687,687 – 2,369,481
Net carrying amount July 31, 2006 443,615 98,724 535,001 101,012 1,178,352
Net carrying amount July 31, 2007 514,720 98,889 497,150 267,676 1,378,435
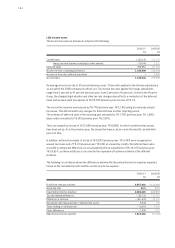
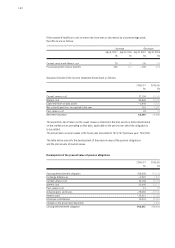
(16) Development of property, plant and equipment