Porsche 2006 Annual Report Download - page 126
Download and view the complete annual report
Please find page 126 of the 2006 Porsche annual report below. You can navigate through the pages in the report by either clicking on the pages listed below, or by using the keyword search tool below to find specific information within the annual report.-
 1
1 -
2
-
3
-
4
-
5
-
6
-
7
-
8
-
9
-
10
-
11
-
12
-
13
-
14
-
15
-
16
-
17
-
18
-
19
-
20
-
21
-
22
-
23
-
24
-
25
-
26
-
27
-
28
-
29
-
30
-
31
-
32
-
33
-
34
-
35
-
36
-
37
-
38
-
39
-
40
-
41
-
42
-
43
-
44
-
45
-
46
-
47
-
48
-
49
-
50
-
51
-
52
-
53
-
54
-
55
-
56
-
57
-
58
-
59
-
60
-
61
-
62
-
63
-
64
-
65
-
66
-
67
-
68
-
69
-
70
-
71
-
72
-
73
-
74
-
75
-
76
-
77
-
78
-
79
-
80
-
81
-
82
-
83
-
84
-
85
-
86
-
87
-
88
-
89
-
90
-
91
-
92
-
93
-
94
-
95
-
96
-
97
-
98
-
99
-
100
-
101
-
102
-
103
-
104
-
105
-
106
-
107
-
108
-
109
-
110
-
111
-
112
-
113
-
114
-
115
-
 116
116 -
 117
117 -
 118
118 -
 119
119 -
 120
120 -
 121
121 -
 122
122 -
 123
123 -
 124
124 -
 125
125 -
 126
126 -
 127
127 -
 128
128 -
 129
129 -
 130
130 -
 131
131 -
 132
132 -
 133
133 -
 134
134 -
 135
135 -
 136
136 -
137
-
138
-
139
-
140
-
141
-
142
-
143
-
144
-
145
-
146
-
147
-
148
-
149
-
150
-
151
-
152
-
153
-
154
-
155
-
156
-
157
-
158
-
159
-
160
-
161
-
162
-
163
-
164
-
165
-
166
-
167
-
168
-
169
-
170
-
171
-
172
-
173
-
174
-
175
-
176
-
177
-
178
-
179
-
180
-
181
-
182
-
183
-
184
-
185
-
186
-
187
-
188
-
189
-
190
 |
 |

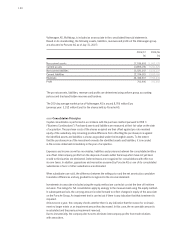
124
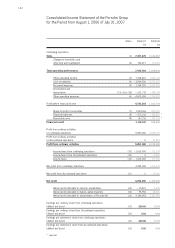
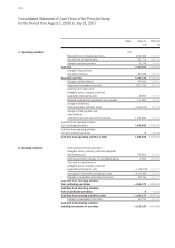
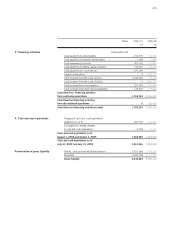
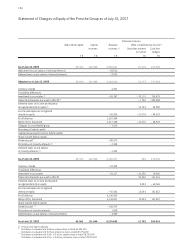
Consolidated Statement of Cash Flows of the Porsche Group
for the Period from August 1, 2006 to July 31, 2007
Notes 2006/07 2005/06
T€ T€
(14)
Net profit from continuing operations 4,242,000 1,314,619
Amortization and depreciation 531,712 488,758
Change in pension provision 61,196 69,663
Cash flow 4,834,908 1,873,040
Changes in tax provision
and other provisions 807,286 227,530
Extended cash flow 5,642,194 2,100,570
Changes in deferred taxes 479,956 138,910
Ohter non-cash expenses/income – 2,917,150 – 390,128
Gain/loss from disposal of
intangible assets, property, plant and
equipment and leased assets – 78,594 – 67,758
Dividend received from investments in associates 111,093 68,280
Change in inventories,
trade receivables and other assets – 3,029,103 – 164,192
Change in trade payables and
other liabilities
(without tax provision and other provisions) 1,686,288 413,424
Cash flow from operating activities
from continuing operations 1,894,684 2,099,106
Cash flow from operating activities
from discontinued operations 0– 18,598
Cash flow from operating activities in total 1,894,684 2,080,508
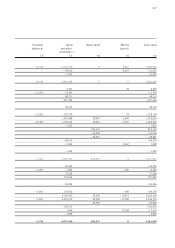
Cash received from the disposal of
intangible assets, property, plant and equipment
and leased assets 456,364 440,647
Cash received from changes to consolidated group 4,768 168,436
Cash paid for investments in
intangible assets, property, plant and
equipment and leased assets – 1,204,745 – 954,167
Cash paid for investments in financial assets – 2,676,450 – 3,122,658
Changes in receivables from financial services – 132,314 – 141,277
Cash flow from investing activities
from continuing operations – 3,552,377 – 3,609,019
Cash flow from investing activities
from discontinued operations 0– 6,110
Cash flow from investing activities in total – 3,552,377 – 3,615,129
Change in investments in securities 317,210 – 955,467
Cash flow from investing activities
including investments in securities – 3,235,167 – 4,570,596
1. Operating activities
2. Investing activities