Porsche 2006 Annual Report Download - page 153
Download and view the complete annual report
Please find page 153 of the 2006 Porsche annual report below. You can navigate through the pages in the report by either clicking on the pages listed below, or by using the keyword search tool below to find specific information within the annual report.-
 1
1 -
2
-
3
-
4
-
5
-
6
-
7
-
8
-
9
-
10
-
11
-
12
-
13
-
14
-
15
-
16
-
17
-
18
-
19
-
20
-
21
-
22
-
23
-
24
-
25
-
26
-
27
-
28
-
29
-
30
-
31
-
32
-
33
-
34
-
35
-
36
-
37
-
38
-
39
-
40
-
41
-
42
-
43
-
44
-
45
-
46
-
47
-
48
-
49
-
50
-
51
-
52
-
53
-
54
-
55
-
56
-
57
-
58
-
59
-
60
-
61
-
62
-
63
-
64
-
65
-
66
-
67
-
68
-
69
-
70
-
71
-
72
-
73
-
74
-
75
-
76
-
77
-
78
-
79
-
80
-
81
-
82
-
83
-
84
-
85
-
86
-
87
-
88
-
89
-
90
-
91
-
92
-
93
-
94
-
95
-
96
-
97
-
98
-
99
-
100
-
101
-
102
-
103
-
104
-
105
-
106
-
107
-
108
-
109
-
110
-
111
-
112
-
113
-
114
-
115
-
116
-
117
-
118
-
119
-
120
-
121
-
122
-
123
-
124
-
125
-
126
-
127
-
128
-
129
-
130
-
131
-
132
-
133
-
134
-
135
-
136
-
137
-
138
-
139
-
140
-
141
-
142
-
 143
143 -
 144
144 -
 145
145 -
 146
146 -
 147
147 -
 148
148 -
 149
149 -
 150
150 -
 151
151 -
 152
152 -
 153
153 -
 154
154 -
 155
155 -
 156
156 -
 157
157 -
 158
158 -
 159
159 -
 160
160 -
 161
161 -
 162
162 -
 163
163 -
164
-
165
-
166
-
167
-
168
-
169
-
170
-
171
-
172
-
173
-
174
-
175
-
176
-
177
-
178
-
179
-
180
-
181
-
182
-
183
-
184
-
185
-
186
-
187
-
188
-
189
-
190
 |
 |

151
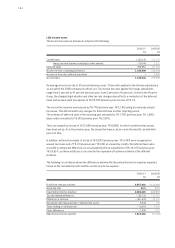
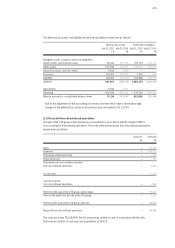
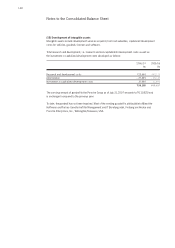
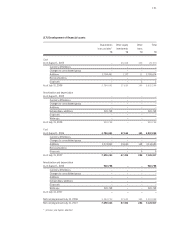
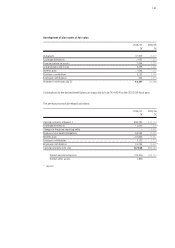
(17) Development of financial assets
Investments Other equity Other Total
in associates* investments loans
T€ T€ T€ T€
Cost
As of August 1, 2005 – 26,438 136 26,574
Currency differences – – – –
Changes to consolidated group – – – –
Additions 3,784,491 1,172 11 3,785,674
Reclassifications – – – –
Disposals – – 2 2
As of July 31, 2006 3,784,491 27,610 145 3,812,246
Amortization and depreciation
As of August 1, 2005 – – – –
Currency differences – – – –
Changes to consolidated group – – – –
Additions – – – –
Extraordinary additions 520,758 – – 520,758
Disposals – – – –
Write-ups – – – –
As of July 31, 2006 520,758 – – 520,758
Cost
As of August 1, 2006 3,784,491 27,610 145 3,812,246
Currency differences – – – –
Changes to consolidated group – – – –
Additions 3,274,842 39,690 148 3,314,680
Reclassifications – – – –
Disposals – – 9 9
As of July 31, 2007 7,059,333 67,300 284 7,126,917
Amortization and depreciation
As of August 1, 2006 520,758 – – 520,758
Currency differences – – – –
Changes to consolidated group – – – –
Additions – – – –
Extraordinary additions – – – –
Disposals – – – –
Write-ups 520,758 – – 520,758
As of July 31, 2007 – – – –
Net carrying amount July 31, 2006 3,263,733 27,610 145 3,291,488
Net carrying amount July 31, 2007 7,059,333 67,300 284 7,126,917
*previous year figures adjusted