Porsche 2006 Annual Report Download - page 170
Download and view the complete annual report
Please find page 170 of the 2006 Porsche annual report below. You can navigate through the pages in the report by either clicking on the pages listed below, or by using the keyword search tool below to find specific information within the annual report.-
 1
1 -
2
-
3
-
4
-
5
-
6
-
7
-
8
-
9
-
10
-
11
-
12
-
13
-
14
-
15
-
16
-
17
-
18
-
19
-
20
-
21
-
22
-
23
-
24
-
25
-
26
-
27
-
28
-
29
-
30
-
31
-
32
-
33
-
34
-
35
-
36
-
37
-
38
-
39
-
40
-
41
-
42
-
43
-
44
-
45
-
46
-
47
-
48
-
49
-
50
-
51
-
52
-
53
-
54
-
55
-
56
-
57
-
58
-
59
-
60
-
61
-
62
-
63
-
64
-
65
-
66
-
67
-
68
-
69
-
70
-
71
-
72
-
73
-
74
-
75
-
76
-
77
-
78
-
79
-
80
-
81
-
82
-
83
-
84
-
85
-
86
-
87
-
88
-
89
-
90
-
91
-
92
-
93
-
94
-
95
-
96
-
97
-
98
-
99
-
100
-
101
-
102
-
103
-
104
-
105
-
106
-
107
-
108
-
109
-
110
-
111
-
112
-
113
-
114
-
115
-
116
-
117
-
118
-
119
-
120
-
121
-
122
-
123
-
124
-
125
-
126
-
127
-
128
-
129
-
130
-
131
-
132
-
133
-
134
-
135
-
136
-
137
-
138
-
139
-
140
-
141
-
142
-
143
-
144
-
145
-
146
-
147
-
148
-
149
-
150
-
151
-
152
-
153
-
154
-
155
-
156
-
157
-
158
-
159
-
 160
160 -
 161
161 -
 162
162 -
 163
163 -
 164
164 -
 165
165 -
 166
166 -
 167
167 -
 168
168 -
 169
169 -
 170
170 -
 171
171 -
 172
172 -
 173
173 -
 174
174 -
 175
175 -
 176
176 -
 177
177 -
 178
178 -
 179
179 -
 180
180 -
181
-
182
-
183
-
184
-
185
-
186
-
187
-
188
-
189
-
190
 |
 |

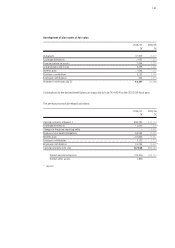
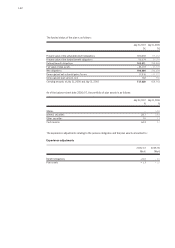
The carrying amounts and market values of the significant primary financial instruments are shown below:
July 31, 2007 July 31, 2006
Carrying Market Carrying Market
amount value amount value
T€ T€ T€ T€
Receivables from financial services 1,781,514 1,817,304 1,683,639 1,722,630
Financial liabilities 6,549,261 6,450,708 4,809,992 4,743,998
168
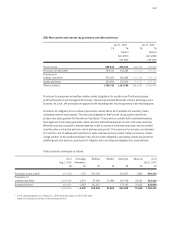
The market value of the financial derivatives is disclosed in the balance sheet under other receivables
and assets or other liabilities. The residual terms of the currency hedges for US dollar hedges is six years,
otherwise no more than four years.
The nominal volume and market value of derivative financial instruments are as follows:
July 31, 2007 July 31, 2006
Nominal Total market Nominal Total market
volume value volume value
T€ T€ T€ T€
Currency hedge 12,198,361 466,268 8,276,098 389,003
Interest hedge 1,091,319 34,998 1,292,744 34,692
Stock options 10,553,364 5,055,224 2,628,055 870,437
23,843,044 5,556,490 12,196,897 1,294,132
Currency hedge 1,357,879 13,866 1,441,224 9,572
Interest hedge 902,830 27,118 886,812 34,818
Stock options 13,473,485 2,445,118 2,441,025 980,716
15,734,194 2,486,102 4,769,061 1,025,106
Assets
Equity and
liabilities
Measurement of financial instruments
The market value of financial instruments is determined by reference to stock market listings, reference
prices or generally accepted calculation models such as the discounted cash flow method.
The following term structure of interest rates was used were appropriate:
The market value of receivables from financial services is determined using the current market interest
rates as of the balance sheet date instead of the internal interest rate.
EUR USD GBP
Interest rate for 6 months 4.39% 5.33% 6.15%
Interest rate for 1 year 4.54% 5.25% 6.29%
Interest rate for 5 years 4.69% 5.31% 6.10%
Interest rate for 10 years 4.76% 5.53% 5.82%
Interest rate for 15 years 4.83% 5.67% 5.54%