Porsche 2006 Annual Report Download - page 143
Download and view the complete annual report
Please find page 143 of the 2006 Porsche annual report below. You can navigate through the pages in the report by either clicking on the pages listed below, or by using the keyword search tool below to find specific information within the annual report.-
 1
1 -
2
-
3
-
4
-
5
-
6
-
7
-
8
-
9
-
10
-
11
-
12
-
13
-
14
-
15
-
16
-
17
-
18
-
19
-
20
-
21
-
22
-
23
-
24
-
25
-
26
-
27
-
28
-
29
-
30
-
31
-
32
-
33
-
34
-
35
-
36
-
37
-
38
-
39
-
40
-
41
-
42
-
43
-
44
-
45
-
46
-
47
-
48
-
49
-
50
-
51
-
52
-
53
-
54
-
55
-
56
-
57
-
58
-
59
-
60
-
61
-
62
-
63
-
64
-
65
-
66
-
67
-
68
-
69
-
70
-
71
-
72
-
73
-
74
-
75
-
76
-
77
-
78
-
79
-
80
-
81
-
82
-
83
-
84
-
85
-
86
-
87
-
88
-
89
-
90
-
91
-
92
-
93
-
94
-
95
-
96
-
97
-
98
-
99
-
100
-
101
-
102
-
103
-
104
-
105
-
106
-
107
-
108
-
109
-
110
-
111
-
112
-
113
-
114
-
115
-
116
-
117
-
118
-
119
-
120
-
121
-
122
-
123
-
124
-
125
-
126
-
127
-
128
-
129
-
130
-
131
-
132
-
 133
133 -
 134
134 -
 135
135 -
 136
136 -
 137
137 -
 138
138 -
 139
139 -
 140
140 -
 141
141 -
 142
142 -
 143
143 -
 144
144 -
 145
145 -
 146
146 -
 147
147 -
 148
148 -
 149
149 -
 150
150 -
 151
151 -
 152
152 -
 153
153 -
154
-
155
-
156
-
157
-
158
-
159
-
160
-
161
-
162
-
163
-
164
-
165
-
166
-
167
-
168
-
169
-
170
-
171
-
172
-
173
-
174
-
175
-
176
-
177
-
178
-
179
-
180
-
181
-
182
-
183
-
184
-
185
-
186
-
187
-
188
-
189
-
190
 |
 |

141
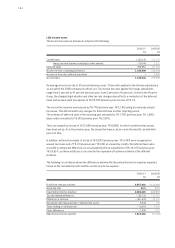
(2) Changes in inventories and own work capitalized
Own work capitalized is principally a result of the capitalization of vehicles and
development costs.
(3) Other operating income
Other operating income breaks down as follows:
The breakdown of sales by geographical segment and business division can be seen under
segment reporting.
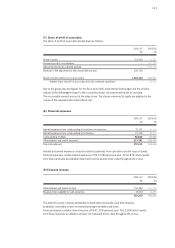
Notes to the Consolidated Income Statement
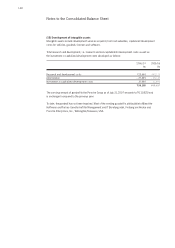
(1) Sales
2006/07 2005/06
T€ T€
Divisions
Vehicles 6,214,192 6,056,241
Parts and accessories 486,490 426,250
Other 667,194 640,176
of which revenue from credit financing 117,198 109,413
of which revenue from lease installments 226,117 224,028
7,367,876 7,122,667
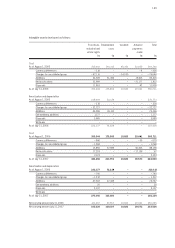
2006/07 2005/06
T€ T€
Income from stock options 6,926,751 767,169
Income from the reversal of imparments and provisions 72,988 47,538
Exchange rate gains 7,090 9,373
Sundry operating income 257,587 221,047
7,264,416 1,045,127
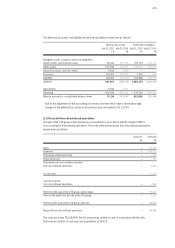
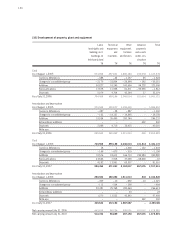
(4) Cost of materials
Income from stock options mainly results from hedges transactions with cash compensation.
Sundry operating income includes income from securities of T€ 8,855 (previous year: T€ 0) which
was accounted for at fair value through profit or loss.
2006/07 2005/06
T€ T€
Cost of materials and supplies
and of purchased merchandise 3,128,438 2,819,864
Cost of purchased services 531,082 453,643
3,659,520 3,273,507