Panera Bread 2008 Annual Report Download - page 90
Download and view the complete annual report
Please find page 90 of the 2008 Panera Bread annual report below. You can navigate through the pages in the report by either clicking on the pages listed below, or by using the keyword search tool below to find specific information within the annual report.-
 1
1 -
2
-
3
-
4
-
5
-
6
-
7
-
8
-
9
-
10
-
11
-
12
-
13
-
14
-
15
-
16
-
17
-
18
-
19
-
20
-
21
-
22
-
23
-
24
-
25
-
26
-
27
-
28
-
29
-
30
-
31
-
32
-
33
-
34
-
35
-
36
-
37
-
38
-
39
-
40
-
41
-
42
-
43
-
44
-
45
-
46
-
47
-
48
-
49
-
50
-
51
-
52
-
53
-
54
-
55
-
56
-
57
-
58
-
59
-
60
-
61
-
62
-
63
-
64
-
65
-
66
-
67
-
68
-
69
-
70
-
71
-
72
-
73
-
74
-
75
-
76
-
77
-
78
-
79
-
 80
80 -
 81
81 -
 82
82 -
 83
83 -
 84
84 -
 85
85 -
 86
86 -
 87
87 -
 88
88 -
 89
89 -
 90
90 -
 91
91 -
 92
92 -
 93
93 -
 94
94 -
 95
95 -
 96
96 -
 97
97 -
 98
98 -
 99
99
 |
 |

December 30,
2008
December 25,
2007
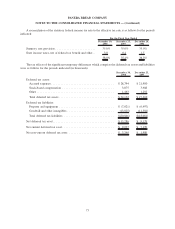
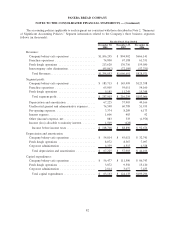
Segment assets:
Company bakery-cafe operations............................ $503,928 $514,528
Franchise operations ..................................... 5,951 6,179
Fresh dough operations ................................... 50,699 55,350
Total segment assets ................................... $560,578 $576,057
Unallocated trade and other accounts receivable ................ 2,435 2,468
Unallocated property and equipment ......................... 13,673 15,016
Unallocated deposits and other ............................. 5,109 4,592
Other unallocated assets .................................. 92,122 100,619
Total assets .......................................... $673,917 $698,752
“Unallocated trade and other accounts receivable” relates primarily to rebates and interest receivable,
“unallocated property and equipment” relates primarily to corporate fixed assets, “unallocated deposits and other”
relates primarily to company-owned life insurance program, and “other unallocated assets” relates primarily to cash
and cash equivalents and investments.
20. Earnings Per Share
The following table sets forth the computation of basic and diluted earnings per share (in thousands, except for
per share data):
December 30,
2008
December 25,
2007
December 26,
2006
For the Fiscal Year Ended
Amounts used for basic and diluted per share
calculations:
Net income .................................. $67,436 $57,456 $58,849
Weighted average number of shares outstanding —
basic ..................................... 30,059 31,708 31,313
Effect of dilutive securities:
Employee stock options ....................... 274 406 690
LTIP..................................... 89 64 41
Weighted average number of shares outstanding —
diluted .................................... 30,422 32,178 32,044
Basic earnings per common share:
Net income .................................. $ 2.24 $ 1.81 $ 1.88
Diluted earnings per common share:
Net income .................................. $ 2.22 $ 1.79 $ 1.84
For the fiscal years ended December 30, 2008, December 25, 2007, and December 26, 2006, weighted-average
options and restricted stock for 0.6 million, 0.3 million, and 0.3 million shares, respectively, were excluded in
calculating diluted earnings per share as the exercise price exceeded fair market value and inclusion would have
been anti-dilutive.
83
PANERA BREAD COMPANY
NOTES TO THE CONSOLIDATED FINANCIAL STATEMENTS — (Continued)