Panera Bread 2008 Annual Report Download - page 56
Download and view the complete annual report
Please find page 56 of the 2008 Panera Bread annual report below. You can navigate through the pages in the report by either clicking on the pages listed below, or by using the keyword search tool below to find specific information within the annual report.-
 1
1 -
2
-
3
-
4
-
5
-
6
-
7
-
8
-
9
-
10
-
11
-
12
-
13
-
14
-
15
-
16
-
17
-
18
-
19
-
20
-
21
-
22
-
23
-
24
-
25
-
26
-
27
-
28
-
29
-
30
-
31
-
32
-
33
-
34
-
35
-
36
-
37
-
38
-
39
-
40
-
41
-
42
-
43
-
44
-
45
-
 46
46 -
 47
47 -
 48
48 -
 49
49 -
 50
50 -
 51
51 -
 52
52 -
 53
53 -
 54
54 -
 55
55 -
 56
56 -
 57
57 -
 58
58 -
 59
59 -
 60
60 -
 61
61 -
 62
62 -
 63
63 -
 64
64 -
 65
65 -
 66
66 -
67
-
68
-
69
-
70
-
71
-
72
-
73
-
74
-
75
-
76
-
77
-
78
-
79
-
80
-
81
-
82
-
83
-
84
-
85
-
86
-
87
-
88
-
89
-
90
-
91
-
92
-
93
-
94
-
95
-
96
-
97
-
98
-
99
 |
 |

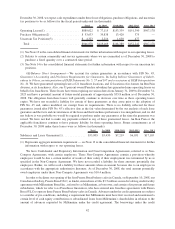
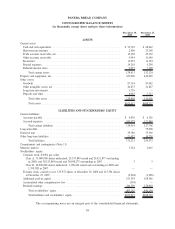
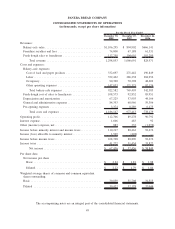
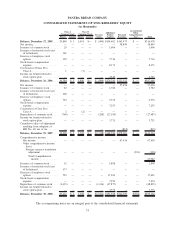
PANERA BREAD COMPANY
CONSOLIDATED STATEMENTS OF OPERATIONS
(in thousands, except per share information)
December 30,
2008
December 25,
2007
December 26,
2006
For the Fiscal Year Ended
Revenues:
Bakery-cafe sales ................................... $1,106,295 $ 894,902 $666,141
Franchise royalties and fees ........................... 74,800 67,188 61,531
Fresh dough sales to franchisees ........................ 117,758 104,601 101,299
Total revenue .................................. 1,298,853 1,066,691 828,971
Costs and expenses:
Bakery-cafe expenses:
Cost of food and paper products ...................... 332,697 271,442 196,849
Labor .......................................... 352,462 286,238 204,956
Occupancy ...................................... 90,390 70,398 48,602
Other operating expenses ........................... 147,033 121,325 92,176
Total bakery-cafe expenses ........................ 922,582 749,403 542,583
Fresh dough cost of sales to franchisees .................. 108,573 92,852 85,951
Depreciation and amortization ......................... 67,225 57,903 44,166
General and administrative expenses ..................... 84,393 68,966 59,306
Pre-opening expenses ................................ 3,374 8,289 6,173
Total costs and expenses .......................... 1,186,147 977,413 738,179
Operating profit ...................................... 112,706 89,278 90,792
Interest expense ...................................... 1,606 483 92
Other (income) expense, net ............................. 883 333 (1,976)
Income before minority interest and income taxes ............. 110,217 88,462 92,676
Income (loss) allocable to minority interest .................. 1,509 (428) —
Income before income taxes ............................. 108,708 88,890 92,676
Income taxes ........................................ 41,272 31,434 33,827
Net income .................................... $ 67,436 $ 57,456 $ 58,849
Per share data:
Net income per share
Basic .......................................... $ 2.24 $ 1.81 $ 1.88
Diluted ......................................... $ 2.22 $ 1.79 $ 1.84
Weighted average shares of common and common equivalent
shares outstanding:
Basic ............................................ 30,059 31,708 31,313
Diluted .......................................... 30,422 32,178 32,044
The accompanying notes are an integral part of the consolidated financial statements.
49