Panera Bread 2008 Annual Report Download - page 40
Download and view the complete annual report
Please find page 40 of the 2008 Panera Bread annual report below. You can navigate through the pages in the report by either clicking on the pages listed below, or by using the keyword search tool below to find specific information within the annual report.-
 1
1 -
2
-
3
-
4
-
5
-
6
-
7
-
8
-
9
-
10
-
11
-
12
-
13
-
14
-
15
-
16
-
17
-
18
-
19
-
20
-
21
-
22
-
23
-
24
-
25
-
26
-
27
-
28
-
29
-
 30
30 -
 31
31 -
 32
32 -
 33
33 -
 34
34 -
 35
35 -
 36
36 -
 37
37 -
 38
38 -
 39
39 -
 40
40 -
 41
41 -
 42
42 -
 43
43 -
 44
44 -
 45
45 -
 46
46 -
 47
47 -
 48
48 -
 49
49 -
 50
50 -
51
-
52
-
53
-
54
-
55
-
56
-
57
-
58
-
59
-
60
-
61
-
62
-
63
-
64
-
65
-
66
-
67
-
68
-
69
-
70
-
71
-
72
-
73
-
74
-
75
-
76
-
77
-
78
-
79
-
80
-
81
-
82
-
83
-
84
-
85
-
86
-
87
-
88
-
89
-
90
-
91
-
92
-
93
-
94
-
95
-
96
-
97
-
98
-
99
 |
 |
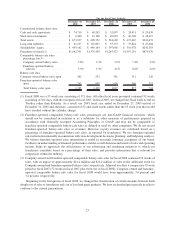
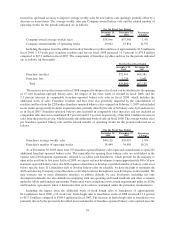
Fresh dough sales to franchisees in fiscal 2007 increased 3.3 percent to $104.6 million compared to
$101.3 million in fiscal 2006. The increase in fresh dough sales to franchisees was primarily driven by the
previously described increased number of franchise-operated bakery-cafes opened and the purchase of one
bakery-cafe from us since the prior fiscal year, partially offset by lower overall dough sales resulting from a
shift in bakery-cafe menu mix away from the bread and bagels we self-manufacture in our fresh dough facilities.
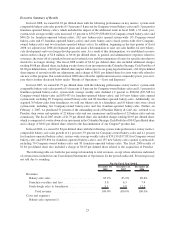
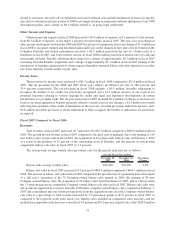
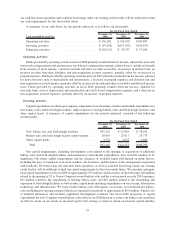
Costs and Expenses
The cost of food and paper products includes the costs associated with the fresh dough operations that sell fresh
dough products to Company-owned bakery-cafes, as well as the cost of food and paper products supplied by third-
party vendors and distributors. The costs associated with the fresh dough operations that sell fresh dough products to
the franchise-operated bakery-cafes are excluded and are shown separately as fresh dough cost of sales to
franchisees in the Consolidated Statements of Operations. The cost of food and paper products was $271.4 million,
or 30.3 percent of bakery-cafe sales, in fiscal 2007, compared to $196.8 million, or 29.6 percent of bakery-cafe
sales, in fiscal 2006. This increase in the cost of food and paper products as a percentage of bakery-cafe sales
between the 2007 and 2006 fiscal years was primarily due to commodity pressures from items such as wheat, dairy,
gasoline and proteins, coupled with general inflationary cost pressures, which outpaced the increase in sales prices
over the same fiscal years; a shift in consumer demand to products involving higher ingredient costs; and a modest
shift in mix away from bakery-cafe related products such as breads and bagels, which we self-manufacture in our
fresh dough facilities, towards baked and sweet goods such as soufflés, scones and muffins, which are produced
through a contract manufacturer. Partially offsetting these cost pressures was improved leverage of our fresh dough
manufacturing costs due to additional bakery-cafes opening. In fiscal 2007, there was an average of 55.8 bakery-
cafes per fresh dough facility compared to an average of 50.7 for the prior fiscal year.
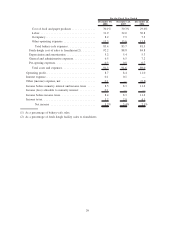
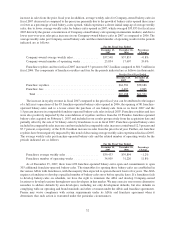
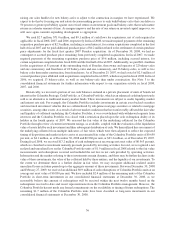
Labor expense was $286.2 million, or 32.0 percent of bakery-cafe sales, in fiscal 2007 compared to
$205.0 million, or 30.8 percent of bakery-cafe sales, in fiscal 2006. The labor expense as a percentage of
bakery-cafe sales increased between the 2007 and 2006 fiscal years primarily as a result of the additional labor
required in our bakery-cafes in support of our evening daypart initiative launched in the third quarter of fiscal 2006,
higher bakery-cafe labor in conjunction with the roll-out of certain operational improvement initiatives focusing on
our lunch daypart, and general inflationary cost pressures, which outpaced the increase in sales prices over the same
fiscal years.
Occupancy cost was $70.4 million, or 7.9 percent of bakery-cafe sales, in fiscal 2007 compared to
$48.6 million, or 7.3 percent of bakery-cafe sales, in fiscal 2006. The increase in occupancy cost as a percentage
of bakery-cafe sales between the 2007 and 2006 fiscal years was primarily due to higher average per square foot
costs in newer markets outpacing the growth in sales in 2007.
Other operating expenses of $121.3 million, or 13.6 percent of bakery-cafe sales, in fiscal 2007 remained
consistent with fiscal 2006 of $92.2 million, or 13.8 percent of bakery-cafe sales.
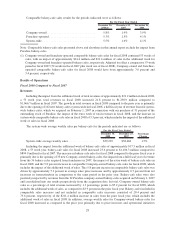
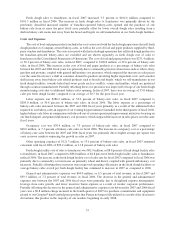
Fresh dough facility cost of sales to franchisees was $92.9 million, or 88.8 percent of fresh dough facility sales
to franchisees, in fiscal 2007, compared to $86.0 million, or 84.8 percent of fresh dough facility sales to franchisees,
in fiscal 2006. The increase in the fresh dough facility cost of sales rate for fiscal 2007 compared to fiscal 2006 was
primarily due to commodity cost increases on primarily wheat and diesel, coupled with general inflationary cost
increases. Partially offsetting these increases were improved operating efficiencies in the fresh dough facilities as
average bakery-cafes served per fresh dough facility has continued to increase in 2007 as compared to 2006.
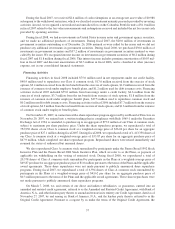
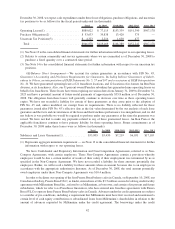
General and administrative expenses was $69.0 million, or 6.5 percent of total revenue, in fiscal 2007 and
$59.3 million, or 7.2 percent of total revenue, in fiscal 2006. The decrease in the general and administrative
expenses rate between the 2007 and 2006 fiscal years were primarily due to disciplined expense management,
leverage from sales growth, and lower incentive bonus expense as a result of weaker corporate performance.
Partially offsetting the decrease in the general and administrative expenses rate between the 2007 and 2006 fiscal
years was a $0.8 million charge incurred in the fourth quarter of 2007 for purchase commitments and equipment
related to our Crispani»hand-crafted pizza product that Panera no longer fully utilized as a result of the decision to
discontinue this product in the majority of our markets beginning in early 2008.
33