Panera Bread 2008 Annual Report Download - page 46
Download and view the complete annual report
Please find page 46 of the 2008 Panera Bread annual report below. You can navigate through the pages in the report by either clicking on the pages listed below, or by using the keyword search tool below to find specific information within the annual report.-
 1
1 -
2
-
3
-
4
-
5
-
6
-
7
-
8
-
9
-
10
-
11
-
12
-
13
-
14
-
15
-
16
-
17
-
18
-
19
-
20
-
21
-
22
-
23
-
24
-
25
-
26
-
27
-
28
-
29
-
30
-
31
-
32
-
33
-
34
-
35
-
 36
36 -
 37
37 -
 38
38 -
 39
39 -
 40
40 -
 41
41 -
 42
42 -
 43
43 -
 44
44 -
 45
45 -
 46
46 -
 47
47 -
 48
48 -
 49
49 -
 50
50 -
 51
51 -
 52
52 -
 53
53 -
 54
54 -
 55
55 -
 56
56 -
57
-
58
-
59
-
60
-
61
-
62
-
63
-
64
-
65
-
66
-
67
-
68
-
69
-
70
-
71
-
72
-
73
-
74
-
75
-
76
-
77
-
78
-
79
-
80
-
81
-
82
-
83
-
84
-
85
-
86
-
87
-
88
-
89
-
90
-
91
-
92
-
93
-
94
-
95
-
96
-
97
-
98
-
99
 |
 |
year. We perform our annual impairment assessment as of the first day of the fourth quarter of each year. Impairment
is tested in accordance with SFAS No. 142, Goodwill and Other Intangibles, by comparison of the carrying value of
the reporting unit to its estimated fair value. As there are not quoted prices for our reporting units, fair value is
estimated based upon a present value technique using estimated discounted future cash flows, forecasted over the
reasonably assured lease term for bakery-cafes and fresh dough facilities, with growth rates forecasted for the
reporting units and using a credit adjusted discount rate. We use current results, trends, future prospects, and other
economic factors as the basis for expected future cash flows.
Assumptions in estimating future cash flows are subject to a high degree of judgment and complexity. We
make every effort to forecast these future cash flows as accurately as possible with the information available at the
time the forecast is developed. However, changes in the assumptions and estimates may affect the carrying value of
goodwill, and could result in additional impairment charges in future periods. Factors that have the potential to
create variances between forecasted cash flows and actual results include but are not limited to (i) fluctuations in
sales volumes, (ii) commodity costs, such as wheat and fuel; and (iii) acceptance of our pricing actions undertaken
in response to rapidly changing commodity prices and other product costs. Refer to “Forward-Looking Statements”
included in the beginning of our fiscal 2008 Form 10-K for further information regarding the impact of estimates of
future cash flows.
The calculation of fair value could increase or decrease depending on changes in the inputs and assumptions
used, such as changes in the financial performance of the reporting units, future growth rate, and discount rate. In
order to evaluate the sensitivity of the fair value calculations on the goodwill impairment test, we applied a
hypothetical decrease in cash flows, and made changes to our projected growth rate and discount rate which we
believe our considered appropriate. Based on the goodwill analysis performed as of September 24, 2008, the first
day of our fiscal fourth quarter, the outlined changes in our assumptions would not affect the results of the
impairment test, as all markets still have an excess of fair value over the carrying value.
While we currently believe that the fair value of both reporting units exceeds carrying value under the
discounted cash flow model, there can be no assurance that future goodwill impairment tests will not result in a
charge to earnings. As of December 30, 2008, we determined there was no impairment of goodwill.
Self-Insurance
We are self-insured for a significant portion of our workers’ compensation, group health, and general, auto, and
property liability insurance with varying levels of deductibles of as much as $0.5 million of individual claims,
depending on the type of claim. We also purchase aggregate stop-loss and/or layers of loss insurance in many
categories of loss. We utilize third party actuarial experts’ estimates of expected losses based on statistical analyses
of historical industry data, as well as our own estimates based on our actual historical data to determine required
self-insurance reserves. The assumptions are closely reviewed, monitored, and adjusted when warranted by
changing circumstances. The estimated accruals for these liabilities could be affected if actual experience related to
the number of claims and cost per claim differs from these assumptions and historical trends. Based on information
known at December 30, 2008, we believe we have provided adequate reserves for our self-insurance exposure. As of
December 30, 2008 and December 25, 2007, self-insurance reserves were $12.1 million and $8.9 million,
respectively, and were included in accrued expenses in the Consolidated Balance Sheets.
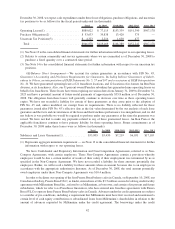
Income Taxes
We are subject to income taxes in the U.S. and Canada. Significant judgment is required in evaluating our
uncertain tax positions and determining our provision for income taxes. FASB issued Interpretation No. 48,
Accounting for Uncertainty in Income Taxes, or FIN No. 48, which contains a two-step approach to recognizing and
measuring uncertain tax positions accounted for in accordance with SFAS No. 109, Accounting for Income Taxes.
The first step is to evaluate the tax position for recognition by determining if the weight of available evidence
indicates that it is more likely than not that the position will be sustained on audit, including resolution of related
appeals or litigation processes, if any. The second step is to measure the tax benefit as the largest amount that is more
than 50 percent likely of being realized upon settlement.
39