Panera Bread 2008 Annual Report Download - page 86
Download and view the complete annual report
Please find page 86 of the 2008 Panera Bread annual report below. You can navigate through the pages in the report by either clicking on the pages listed below, or by using the keyword search tool below to find specific information within the annual report.-
 1
1 -
2
-
3
-
4
-
5
-
6
-
7
-
8
-
9
-
10
-
11
-
12
-
13
-
14
-
15
-
16
-
17
-
18
-
19
-
20
-
21
-
22
-
23
-
24
-
25
-
26
-
27
-
28
-
29
-
30
-
31
-
32
-
33
-
34
-
35
-
36
-
37
-
38
-
39
-
40
-
41
-
42
-
43
-
44
-
45
-
46
-
47
-
48
-
49
-
50
-
51
-
52
-
53
-
54
-
55
-
56
-
57
-
58
-
59
-
60
-
61
-
62
-
63
-
64
-
65
-
66
-
67
-
68
-
69
-
70
-
71
-
72
-
73
-
74
-
75
-
 76
76 -
 77
77 -
 78
78 -
 79
79 -
 80
80 -
 81
81 -
 82
82 -
 83
83 -
 84
84 -
 85
85 -
 86
86 -
 87
87 -
 88
88 -
 89
89 -
 90
90 -
 91
91 -
 92
92 -
 93
93 -
 94
94 -
 95
95 -
 96
96 -
97
-
98
-
99
 |
 |

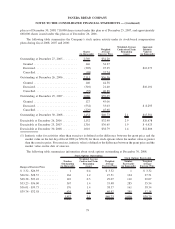
plan as of December 30, 2008, 710,000 shares issued under this plan as of December 25, 2007, and approximately
668,000 shares issued under this plan as of December 26, 2006.
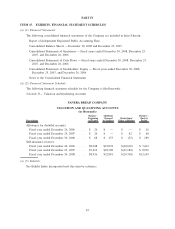
The following table summarizes the Company’s stock option activity under its stock-based compensation
plans during fiscal 2008, 2007 and 2006:
Shares
(in thousands)
Weighted
Average
Exercise Price
Weighted Average
Contractual Term
Remaining
(years)
Aggregate
Intrinsic
Value(1)
(in thousands)
Outstanding at December 27, 2005 ......... 2,569 $34.20
Granted ........................... 146 54.27
Exercised .......................... (305) 25.25 $12,273
Cancelled.......................... (99) 37.74
Outstanding at December 26, 2006 ......... 2,311 $36.36
Granted ........................... 140 44.58
Exercised .......................... (310) 21.40 $10,101
Cancelled.......................... (55) 40.88
Outstanding at December 25, 2007 ......... 2,086 $39.05
Granted ........................... 127 45.06
Exercised .......................... (532) 33.03 $ 8,293
Cancelled.......................... (229) 45.68
Outstanding at December 30, 2008 ......... 1,452 $40.73 2.1 $15,581
Exercisable at December 26, 2006 ......... 1,152 $32.40 2.9 $26,678
Exercisable at December 25, 2007 ......... 1,316 $36.65 1.9 $ 4,425
Exercisable at December 30, 2008 ......... 1,016 $38.79 1.4 $12,806
(1) Intrinsic value for activities other than exercises is defined as the difference between the grant price and the
market value on the last day of fiscal 2008 (or $50.22) for those stock options where the market value is greater
than the exercise price. For exercises, intrinsic value is defined as the difference between the grant price and the
market value on the date of exercise.
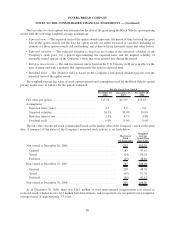
The following table summarizes information about stock options outstanding at December 30, 2008:
Range of Exercise Price
Number
Outstanding
(in thousands)
Weighted Average
Contractual Term
Remaining
(years)
Weighted
Average
Exercise Price
Number
Exercisable
(in thousands)
Weighted
Average
Exercise Price
Stock Options Outstanding
Stock Options Exercisable
$ 3.32 - $26.93 ........... 1 0.4 $ 3.32 1 $ 3.32
$26.94 - $28.37 ........... 164 1.2 27.51 164 27.51
$28.38 - $33.22 ........... 110 0.3 29.07 110 29.07
$33.23 - $36.00 ........... 367 1.4 35.48 285 35.54
$36.01 - $39.73 ........... 176 1.4 38.37 161 38.34
$39.74 - $72.58 ........... 634 3.2 49.92 295 52.18
1,452 2.1 $40.73 1,016 $38.79
79
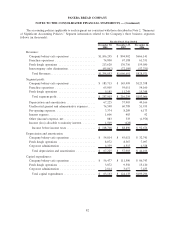
PANERA BREAD COMPANY
NOTES TO THE CONSOLIDATED FINANCIAL STATEMENTS — (Continued)