Panera Bread 2008 Annual Report Download - page 35
Download and view the complete annual report
Please find page 35 of the 2008 Panera Bread annual report below. You can navigate through the pages in the report by either clicking on the pages listed below, or by using the keyword search tool below to find specific information within the annual report.-
 1
1 -
2
-
3
-
4
-
5
-
6
-
7
-
8
-
9
-
10
-
11
-
12
-
13
-
14
-
15
-
16
-
17
-
18
-
19
-
20
-
21
-
22
-
23
-
24
-
 25
25 -
 26
26 -
 27
27 -
 28
28 -
 29
29 -
 30
30 -
 31
31 -
 32
32 -
 33
33 -
 34
34 -
 35
35 -
 36
36 -
 37
37 -
 38
38 -
 39
39 -
 40
40 -
 41
41 -
 42
42 -
 43
43 -
 44
44 -
 45
45 -
46
-
47
-
48
-
49
-
50
-
51
-
52
-
53
-
54
-
55
-
56
-
57
-
58
-
59
-
60
-
61
-
62
-
63
-
64
-
65
-
66
-
67
-
68
-
69
-
70
-
71
-
72
-
73
-
74
-
75
-
76
-
77
-
78
-
79
-
80
-
81
-
82
-
83
-
84
-
85
-
86
-
87
-
88
-
89
-
90
-
91
-
92
-
93
-
94
-
95
-
96
-
97
-
98
-
99
 |
 |

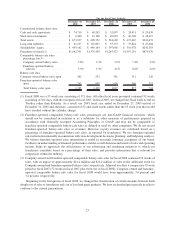
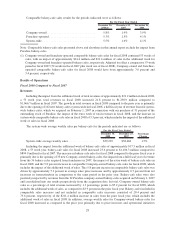
Comparable bakery-cafe sales results for the periods indicated were as follows:
December 30,
2008(1)
December 25,
2007
December 26,
2006
For the Fiscal Year Ended
Company-owned .............................. 5.8% 1.9% 3.9%
Franchise-operated............................. 5.3% 1.5% 4.1%
System-wide ................................. 5.5% 1.6% 4.1%
Note: Comparable bakery-cafe sales presented above and elsewhere in this annual report exclude the impact from
Paradise bakery-cafes.
(1) Company-owned and franchise-operated comparable bakery-cafe sales for fiscal 2008 contained 53 weeks of
sales, with an impact of approximately $14.4 million and $21.4 million of sales in the additional week for
Company-owned and franchise-operated bakery-cafes, respectively. Adjusted to reflect a comparative 53 week
period in fiscal 2007 (52 weeks in fiscal 2007 plus week one of fiscal 2008), Company-owned and franchise-
operated comparable bakery-cafe sales for fiscal 2008 would have been approximately 3.6 percent and
3.4 percent, respectively.
Results of Operations
Fiscal 2008 Compared to Fiscal 2007
Revenues
Including the impact from the additional week of total revenues of approximately $21.2 million in fiscal 2008,
a 53 week year, total revenues in fiscal 2008 increased 21.8 percent to $1,298.9 million compared to
$1,066.7 million in fiscal 2007. The growth in total revenue in fiscal 2008 compared to the prior year is primarily
due to the opening of 102 new bakery-cafes system-wide in fiscal 2008, a full fiscal year of revenue from 44 system-
wide bakery-cafes, which we acquired on February 1, 2007 in connection with our purchase of 51 percent of the
outstanding stock of Paradise, the impact of the extra week of total revenues in fiscal 2008, and the increase in
system-wide comparable bakery-cafe sales in fiscal 2008 of 5.5 percent, which includes the impact of the additional
week of sales in fiscal 2008.
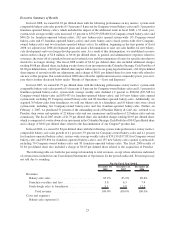
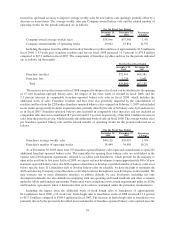
The system-wide average weekly sales per bakery-cafe for the periods indicated are as follows:
December 30,
2008
December 25,
2007
Percentage
Change
For the Fiscal Year Ended
System-wide average weekly sales ................... $39,239 $38,668 1.5%
Including the impact from the additional week of bakery-cafe sales of approximately $17.5 million in fiscal
2008, a 53 week year, bakery-cafe sales for fiscal 2008 increased 23.6 percent to $1,106.3 million compared to
$894.9 million for fiscal 2007. The increase in bakery-cafe sales for fiscal 2008 compared to the prior fiscal year is
primarily due to the opening of 35 new Company-owned bakery-cafes, the impact from a full fiscal year of revenue
from the 36 bakery-cafes acquired from franchisees in 2007, the impact of the extra week of bakery-cafe sales in
fiscal 2008, and the 5.8 percent increase in comparable Company-owned bakery-cafe sales for fiscal 2008, which
includes the impact of the additional week of sales. This 5.8 percent increase in comparable bakery-cafe sales was
driven by approximately 5.1 percent in average sales price increases and by approximately 0.7 percent from net
increases in transaction/mix in comparison to the same period in the prior year. Bakery-cafe sales were also
positively impacted by revenues from the 22 Paradise company-owned bakery-cafes acquired on February 1, 2007
and consolidated into our results prospectively from the acquisition date. In total, Company-owned bakery-cafe
sales as a percentage of total revenue increased by 1.3 percentage points to 85.2 percent for fiscal 2008, which
includes the additional week of sales, as compared to 83.9 percent in the prior fiscal year. Bakery-cafes included in
comparable sales increases and not included in comparable sales increases consisted of 20.4 percent and
79.6 percent, respectively, of the $211.4 million increase in sales from the prior fiscal year, which includes the
additional week of sales in fiscal 2008. In addition, average weekly sales for Company-owned bakery-cafes for
fiscal 2008 increased as compared to the prior year primarily due to price increases and operational initiatives
28