Panera Bread 2008 Annual Report Download - page 57
Download and view the complete annual report
Please find page 57 of the 2008 Panera Bread annual report below. You can navigate through the pages in the report by either clicking on the pages listed below, or by using the keyword search tool below to find specific information within the annual report.-
 1
1 -
2
-
3
-
4
-
5
-
6
-
7
-
8
-
9
-
10
-
11
-
12
-
13
-
14
-
15
-
16
-
17
-
18
-
19
-
20
-
21
-
22
-
23
-
24
-
25
-
26
-
27
-
28
-
29
-
30
-
31
-
32
-
33
-
34
-
35
-
36
-
37
-
38
-
39
-
40
-
41
-
42
-
43
-
44
-
45
-
46
-
 47
47 -
 48
48 -
 49
49 -
 50
50 -
 51
51 -
 52
52 -
 53
53 -
 54
54 -
 55
55 -
 56
56 -
 57
57 -
 58
58 -
 59
59 -
 60
60 -
 61
61 -
 62
62 -
 63
63 -
 64
64 -
 65
65 -
 66
66 -
 67
67 -
68
-
69
-
70
-
71
-
72
-
73
-
74
-
75
-
76
-
77
-
78
-
79
-
80
-
81
-
82
-
83
-
84
-
85
-
86
-
87
-
88
-
89
-
90
-
91
-
92
-
93
-
94
-
95
-
96
-
97
-
98
-
99
 |
 |

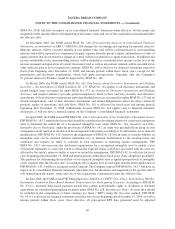
PANERA BREAD COMPANY
CONSOLIDATED STATEMENTS OF CASH FLOWS
(in thousands)
December 30,
2008
December 25,
2007
December 26,
2006
For the Fiscal Year Ended
Cash flows from operations:
Net income . . . . . . . . . . . . . . . . . . . . . . . . . . . . . . . . . . . . . . . . . . . $ 67,436 $ 57,456 $ 58,849
Adjustments to reconcile net income to net cash provided by operating
activities:
Depreciation and amortization . . . . . . . . . . . . . . . . . . . . . . . . . . . . 67,225 57,903 44,166
Loss from short-term investments . . . . . . . . . . . . . . . . . . . . . . . . . . 1,910 967 —
Stock-based compensation expense . . . . . . . . . . . . . . . . . . . . . . . . . 7,954 7,255 8,171
Tax benefit from exercise of stock options . . . . . . . . . . . . . . . . . . . . (3,376) (3,731) (4,346)
Income (loss) allocable to minority interest . . . . . . . . . . . . . . . . . . . 1,509 (428) —
Deferred income taxes . . . . . . . . . . . . . . . . . . . . . . . . . . . . . . . . . . (4,107) (7,276) (5,065)
Other. . . . . . . . . . . . . . . . . . . . . . . . . . . . . . . . . . . . . . . . . . . . . . 228 725 (222)
Changes in operating assets and liabilities, excluding the effect of
acquisitions:
Trade and other accounts receivable . . . . . . . . . . . . . . . . . . . . . . . . 11,650 (5,549) (4,515)
Inventories . . . . . . . . . . . . . . . . . . . . . . . . . . . . . . . . . . . . . . . . . . (565) (1,798) (1,156)
Prepaid expenses. . . . . . . . . . . . . . . . . . . . . . . . . . . . . . . . . . . . . . (8,966) 6,884 (6,300)
Accounts payable . . . . . . . . . . . . . . . . . . . . . . . . . . . . . . . . . . . . . (2,290) (815) 1,378
Accrued expenses . . . . . . . . . . . . . . . . . . . . . . . . . . . . . . . . . . . . . 5,450 32,398 7,629
Deferred rent . . . . . . . . . . . . . . . . . . . . . . . . . . . . . . . . . . . . . . . . 6,211 5,885 3,749
Other long-term liabilities . . . . . . . . . . . . . . . . . . . . . . . . . . . . . . . 6,013 4,138 2,557
Net cash provided by operating activities . . . . . . . . . . . . . . . . . . . 156,282 154,014 104,895
Cash flows from investing activities:
Additions to property and equipment . . . . . . . . . . . . . . . . . . . . . . . . . (63,163) (124,133) (109,296)
Proceeds from sale of assets . . . . . . . . . . . . . . . . . . . . . . . . . . . . . . . — 1,844 1,883
Acquisitions, net of cash acquired . . . . . . . . . . . . . . . . . . . . . . . . . . . (2,704) (71,039) (9,101)
Short-term investments transferred from cash and cash equivalents . . . . . — (26,526) —
Purchase of investments . . . . . . . . . . . . . . . . . . . . . . . . . . . . . . . . . . — — (30,619)
Investment maturities proceeds. . . . . . . . . . . . . . . . . . . . . . . . . . . . . . 17,162 22,361 57,200
Decrease (increase) in deposits and other . . . . . . . . . . . . . . . . . . . . . . 1,042 231 (984)
Net cash used in investing activities . . . . . . . . . . . . . . . . . . . . . . . (47,663) (197,262) (90,917)
Cash flows from financing activities:
Net (payments) borrowing under credit facility . . . . . . . . . . . . . . . . . . (75,000) 75,000 —
Repurchase of common stock . . . . . . . . . . . . . . . . . . . . . . . . . . . . . . (48,893) (27,487) —
Exercise of employee stock options . . . . . . . . . . . . . . . . . . . . . . . . . . 17,621 6,576 7,716
Tax benefit from exercise of stock options. . . . . . . . . . . . . . . . . . . . . . 3,376 3,731 4,346
Proceeds from issuance of common stock . . . . . . . . . . . . . . . . . . . . . . 1,898 1,782 1,606
Capitalized debt issuance costs. . . . . . . . . . . . . . . . . . . . . . . . . . . . . . (1,153) (209) —
Net cash (used in) provided by financing activities . . . . . . . . . . . . (102,151) 59,393 13,668
Net increase in cash and cash equivalents . . . . . . . . . . . . . . . . . . . . . . . . 6,468 16,145 27,646
Cash and cash equivalents at beginning of period . . . . . . . . . . . . . . . . . . 68,242 52,097 24,451
Cash and cash equivalents at end of period . . . . . . . . . . . . . . . . . . . . . . . $ 74,710 $ 68,242 $ 52,097
Supplemental cash flow information:
Cash paid during the year for:
Interest . . . . . . . . . . . . . . . . . . . . . . . . . . . . . . . . . . . . . . . . . . . $ 1,748 $ 165 $ —
Income taxes. . . . . . . . . . . . . . . . . . . . . . . . . . . . . . . . . . . . . . . $ 37,328 $ 28,493 $ 42,227
Noncash investing activities:
Accrued property and equipment purchases . . . . . . . . . . . . . . . . . $ 6,448 $ 17,473 $ 23,396
Accrued acquisition purchase price . . . . . . . . . . . . . . . . . . . . . . . $ — $ 2,501 $ 8,650
The accompanying notes are an integral part of the consolidated financial statements.
50