Panera Bread 2008 Annual Report Download - page 32
Download and view the complete annual report
Please find page 32 of the 2008 Panera Bread annual report below. You can navigate through the pages in the report by either clicking on the pages listed below, or by using the keyword search tool below to find specific information within the annual report.-
 1
1 -
2
-
3
-
4
-
5
-
6
-
7
-
8
-
9
-
10
-
11
-
12
-
13
-
14
-
15
-
16
-
17
-
18
-
19
-
20
-
21
-
 22
22 -
 23
23 -
 24
24 -
 25
25 -
 26
26 -
 27
27 -
 28
28 -
 29
29 -
 30
30 -
 31
31 -
 32
32 -
 33
33 -
 34
34 -
 35
35 -
 36
36 -
 37
37 -
 38
38 -
 39
39 -
 40
40 -
 41
41 -
 42
42 -
43
-
44
-
45
-
46
-
47
-
48
-
49
-
50
-
51
-
52
-
53
-
54
-
55
-
56
-
57
-
58
-
59
-
60
-
61
-
62
-
63
-
64
-
65
-
66
-
67
-
68
-
69
-
70
-
71
-
72
-
73
-
74
-
75
-
76
-
77
-
78
-
79
-
80
-
81
-
82
-
83
-
84
-
85
-
86
-
87
-
88
-
89
-
90
-
91
-
92
-
93
-
94
-
95
-
96
-
97
-
98
-
99
 |
 |

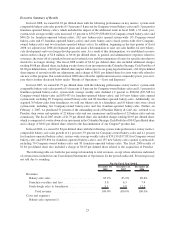
Executive Summary of Results
In fiscal 2008, we earned $2.22 per diluted share with the following performance on key metrics: system-wide
comparable bakery-cafe sales growth of 5.5 percent (5.8 percent for Company-owned bakery-cafes and 5.3 percent for
franchise-operated bakery-cafes), which included the impact of the additional week in fiscal 2008, a 53 week year;
system-wide average weekly sales increased 1.5 percent to $39,239 ($38,066 for Company-owned bakery-cafes and
$40,126 for franchise-operated bakery-cafes); 102 new bakery-cafes opened system-wide (35 Company-owned
bakery-cafes and 67 franchise-operated bakery-cafes); and seven bakery-cafes closed system-wide (five Company-
owned bakery-cafes and two franchise-operated bakery-cafes). In addition, beginning in the first quarter of fiscal
2008, we adjusted our 2008 development plans and made a determination to raise our sales hurdles for new bakery-
cafe development and to no longer develop specific sites. As a result of this determination, we established a reserve
and recorded a charge of $2.8 million, or $0.06 per diluted share, to general and administrative expenses related to
severance, the write-off of capitalized assets and overhead costs and the termination of leases for specific sites that we
decided to no longer develop. The fiscal 2008 results of $2.22 per diluted share also included additional charges
totaling $0.08 per diluted share, including a write-down of our investment in the Columbia Strategic Cash Portfolio of
$0.04 per diluted share, a $0.01 per diluted share impact with respect to on-going legal settlements, a $0.02 per diluted
share impact of an unfavorable tax adjustment, and a charge of $0.01 per diluted share for asset write-offs related to
our new coffee program. Our results in fiscal 2008 also reflect the significant increase in commodity prices year-over-
year that is further discussed below under “Results of Operations — Costs and Expenses.”
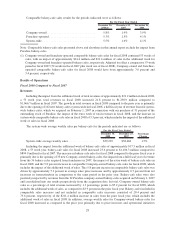
In fiscal 2007, we earned $1.79 per diluted share with the following performance on key metrics: system-wide
comparable bakery-cafe sales growth of 1.6 percent (1.9 percent for Company-owned bakery-cafes and 1.5 percent for
franchise-operated bakery-cafes); system-wide average weekly sales declined 1.2 percent to $38,668 ($37,548 for
Company-owned bakery-cafes and $39,433 for franchise-operated bakery-cafes); and 169 new bakery-cafes opened
system-wide, including 89 Company-owned bakery-cafes and 80 franchise-operated bakery-cafes. Additionally, we
acquired 36 bakery-cafes from franchisees, we sold one bakery-cafe to a franchisee, and 10 bakery-cafes were closed
system-wide, including five Company-owned bakery-cafes and five franchise-operated bakery-cafes. Further, on
February 1, 2007, we purchased 51 percent of the outstanding stock of Paradise Bakery & Café, Inc., referred to as
Paradise, then owner and operator of 22 bakery-cafes and one commissary and franchisor of 22 bakery-cafes and one
commissary. The fiscal 2007 results of $1.79 per diluted share also included charges totaling $0.03 per diluted share,
which is comprised of a write-down of our investment in the Columbia Strategic Cash Portfolio of $0.02 per diluted share
and a charge of $0.01 per diluted share related to the discontinuation of our Crispani»product line.
In fiscal 2006, we earned $1.84 per diluted share with the following system-wide performance on key metrics:
comparable bakery-cafe sales growth of 4.1 percent (3.9 percent for Company-owned bakery-cafes and 4.1 percent
for franchise-operated bakery-cafes); system-wide average weekly sales of $39,150 ($37,833 for Company-owned
bakery-cafes and $39,894 for franchise-operated bakery-cafes); and 155 new bakery-cafes opened system-wide,
including 70 Company-owned bakery-cafes and 85 franchise-operated bakery-cafes. The fiscal 2006 results of
$1.84 per diluted share also included a charge of $0.03 per diluted share related to the acquisition of Paradise.
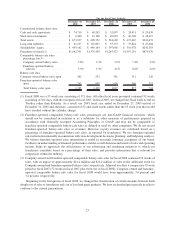
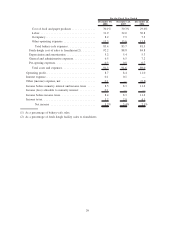
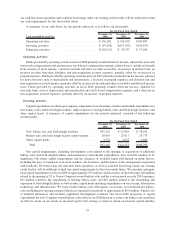
The following table sets forth the percentage relationship to total revenues, except where otherwise indicated,
of certain items included in our Consolidated Statements of Operations for the periods indicated. Percentages may
not add due to rounding:
December 30,
2008
December 25,
2007
December 26,
2006
For the Fiscal Year Ended
Revenues:
Bakery-cafe sales ............................ 85.2% 83.9% 80.4%
Franchise royalties and fees .................... 5.8 6.3 7.4
Fresh dough sales to franchisees ................. 9.1 9.8 12.2
Total revenue ........................... 100.0% 100.0% 100.0%
Costs and expenses:
Bakery-cafe expenses(1):
25