Panera Bread 2008 Annual Report Download - page 41
Download and view the complete annual report
Please find page 41 of the 2008 Panera Bread annual report below. You can navigate through the pages in the report by either clicking on the pages listed below, or by using the keyword search tool below to find specific information within the annual report.-
 1
1 -
2
-
3
-
4
-
5
-
6
-
7
-
8
-
9
-
10
-
11
-
12
-
13
-
14
-
15
-
16
-
17
-
18
-
19
-
20
-
21
-
22
-
23
-
24
-
25
-
26
-
27
-
28
-
29
-
30
-
 31
31 -
 32
32 -
 33
33 -
 34
34 -
 35
35 -
 36
36 -
 37
37 -
 38
38 -
 39
39 -
 40
40 -
 41
41 -
 42
42 -
 43
43 -
 44
44 -
 45
45 -
 46
46 -
 47
47 -
 48
48 -
 49
49 -
 50
50 -
 51
51 -
52
-
53
-
54
-
55
-
56
-
57
-
58
-
59
-
60
-
61
-
62
-
63
-
64
-
65
-
66
-
67
-
68
-
69
-
70
-
71
-
72
-
73
-
74
-
75
-
76
-
77
-
78
-
79
-
80
-
81
-
82
-
83
-
84
-
85
-
86
-
87
-
88
-
89
-
90
-
91
-
92
-
93
-
94
-
95
-
96
-
97
-
98
-
99
 |
 |
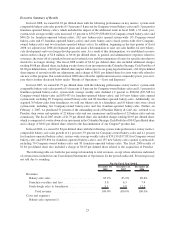
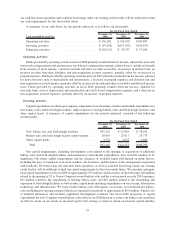
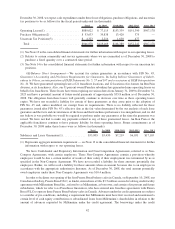
Other Income and Expense
Other income and expense in fiscal 2007 decreased to $0.3 million of expense, or less than 0.1 percent of total
revenue, from $2.0 million of income, or 0.2 percent of total revenue, in fiscal 2006. The decrease in other income
and expense for fiscal 2007 compared to fiscal 2006 was primarily from lower interest income in 2007 resulting
from lower cash and investments on-hand in 2007; a charge of approximately $0.2 million in the first quarter of
2007 stemming from the Paradise acquisition; a charge of approximately $1.1 million in the second quarter of 2007
relating to the termination of franchise agreements for certain acquired franchise-operated bakery-cafes that
operated at a royalty rate lower that the current market royalty rates; and a charge of approximately $1.0 million in
the fourth quarter of 2007 relating to an unrealized loss on our investment in the Columbia Strategic Cash Portfolio,
or the Columbia Portfolio, as a result of adverse market conditions that unfavorably affected the fair value and
liquidity of collateral underlying the Columbia Portfolio. Partially offsetting these items was a $0.5 million gain
from the sale of a bakery-cafe to a franchisee in the second quarter of 2007. See Note 3 to the consolidated financial
statements for further information with respect to the acquisition charges and gain on sale of the bakery-cafe and
Note 4 for further discussion regarding the Columbia Portfolio. Other income and expense in fiscal 2006 primarily
included interest income and $1.5 million of charges associated with the Paradise acquisition.
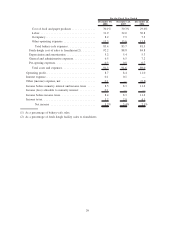
Income Taxes
The provision for income taxes decreased to $31.4 million in fiscal 2007 compared to $33.8 million in fiscal
2006. The tax provision for the 2007 and 2006 fiscal years reflected an effective tax rate of 35.4 percent and
36.5 percent, respectively. The tax provision in fiscal 2007 included $0.9 million of charges related to unfavorable
FASB Interpretation No. 48, Accounting for Uncertainty in Income Taxes, or FIN No. 48, tax adjustments primarily
for certain state tax law changes; a $1.5 million tax benefit reflecting the expiration of the statute of limitations on
the recovery of certain previously deducted expenses; and a $0.8 million favorable provision to return adjustment to
fully recognize the benefit of deductions not previously recognized. Additionally, we adopted the provisions of
FIN No. 48 effective December 27, 2006. As a result of the implementation of FIN No. 48, we increased our existing
reserves for uncertain tax positions by $1.2 million in the first quarter of 2007, largely related to state income tax
matters. Of this amount, $0.4 million was recorded as deferred tax assets relating to the estimated federal tax
benefits and $0.8 million was recorded as a cumulative-effect adjustment to the beginning balance of retained
earnings. See Note 14 to the consolidated financial statements for further information with respect to the adoption of
FIN No. 48.
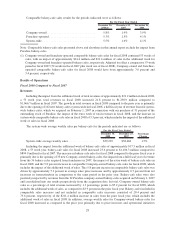
Liquidity and Capital Resources
Cash and cash equivalents were $74.7 million at December 30, 2008 as compared with $68.2 million at
December 25, 2007. This increase is primarily a result of the $156.3 million of cash generated from operations, the
$17.6 million received from the exercise of employee stock options, and the $17.2 million received in investment
maturity proceeds during fiscal 2008, partially offset by the $75.0 million used to repay long-term debt, the
$63.2 million used for capital expenditures, and the $48.9 million used in share repurchases. Our primary source of
liquidity is cash provided by operations, although we have also borrowed under a credit facility principally to
finance repurchases of our common stock. Historically, our principal requirements for cash have primarily resulted
from our capital expenditures for the development of new Company-owned bakery-cafes, for maintaining or
remodeling existing Company-owned bakery-cafes, for purchasing existing franchise-operated bakery-cafes or
ownership interests in other restaurant or bakery-cafe concepts, for developing, maintaining or remodeling fresh
dough facilities, and for other capital needs such as enhancements to information systems and other infrastructure.
See Notes 11 and 12 to the consolidated financial statements for further information with respect to our credit
facility and our share repurchase program, respectively.
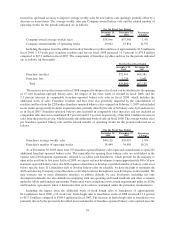
We had net working capital of $24.4 million at both December 30, 2008 and December 25, 2007. The
consistency in working capital from December 25, 2007 to December 30, 2008 resulted primarily from a decrease in
accrued expenses of $11.5 million, an increase in prepaid expenses of $9.0 million, an increase in cash and cash
equivalents of $6.5 million, and an increase in deferred taxes of $2.7 million, offset by a decrease in short-term
investments of $20.8 million and a decrease in trade and other accounts receivable of $11.7 million. We believe that
34