Nordstrom 2006 Annual Report Download - page 68
Download and view the complete annual report
Please find page 68 of the 2006 Nordstrom annual report below. You can navigate through the pages in the report by either clicking on the pages listed below, or by using the keyword search tool below to find specific information within the annual report.-
 1
1 -
2
-
3
-
4
-
5
-
6
-
7
-
8
-
9
-
10
-
11
-
12
-
13
-
14
-
15
-
16
-
17
-
18
-
19
-
20
-
21
-
22
-
23
-
24
-
25
-
26
-
27
-
28
-
29
-
30
-
31
-
32
-
33
-
34
-
35
-
36
-
37
-
38
-
39
-
40
-
41
-
42
-
43
-
44
-
45
-
46
-
47
-
48
-
49
-
50
-
51
-
52
-
53
-
54
-
55
-
56
-
57
-
 58
58 -
 59
59 -
 60
60 -
 61
61 -
 62
62 -
 63
63 -
 64
64 -
 65
65 -
 66
66 -
 67
67 -
 68
68 -
 69
69 -
 70
70 -
 71
71 -
 72
72 -
 73
73 -
 74
74 -
 75
75 -
 76
76 -
 77
77 -
 78
78 -
79
-
80
-
81
-
82
-
83
-
84
-
85
-
86
 |
 |

50
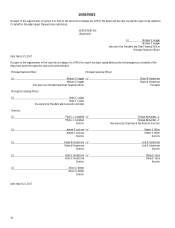
Nordstrom, Inc.
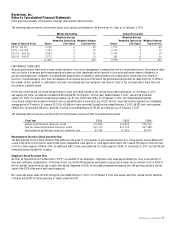
Notes to Consolidated Financial Statements
Dollar and share amounts in thousands except per share and per option amounts
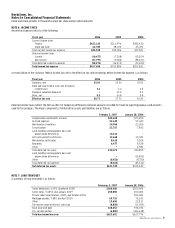
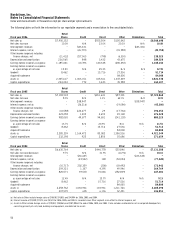
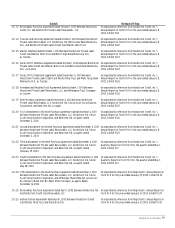
The following tables set forth the information for our reportable segments and a reconciliation to the consolidated totals:
Retail
Fiscal year 2006
Stores
Credit
Direct
Other
Eliminations
Total
Net sales (a)
$7,900,152
—
$555,504
$105,042
—
$8,560,698
Net sales increase
10.0%
N/A
23.0%
20.3%
N/A
10.8%
Intersegment revenues
—
$43,431
—
—
$(43,431)
—
Interest expense, net (b)
—
(26,770)
—
(15,988)
—
(42,758)
Other income (expense) including
finance charges, net
(11,412)
257,065
(798)
(6,330)
—
238,525
Depreciation and amortization
236,565
848
3,432
43,675
—
284,520
Earnings before income tax expense
1,185,401
60,396
140,348
(280,492)
—
1,105,653
Earnings before income tax expense
as a percentage of net sales
15.0%
N/A
25.3%
N/A
N/A
12.9%
Goodwill
8,462
—
15,716
27,536
—
51,714
Acquired tradename
—
—
—
84,000
—
84,000
Assets (c)
2,305,617
1,063,151
105,361
1,347,449
—
4,821,578
Capital expenditures
224,434
772
3,243
35,988
—
264,437
Retail
Fiscal year 2005
Stores
Credit
Direct
Other
Eliminations
Total
Net sales (a)
$7,183,918
—
$451,641
$87,301
—
$7,722,860
Net sales increase
8.3%
N/A
1.1%
62.1%
N/A
8.3%
Intersegment revenues
—
$38,947
—
—
$(38,947)
—
Interest expense, net (b)
—
(26,216)
—
(19,084)
—
(45,300)
Other income (expense) including
finance charges, net
(10,588)
224,677
29
(17,764)
—
196,354
Depreciation and amortization
223,258
1,209
2,693
49,168
—
276,328
Earnings before income tax expense
982,065
49,677
94,601
(241,118)
—
885,225
Earnings before income tax expense
as a percentage of net sales
13.7%
N/A
20.9%
N/A
N/A
11.5%
Goodwill
8,462
—
15,716
27,536
—
51,714
Acquired tradename
—
—
—
84,000
—
84,000
Assets (c)
2,285,259
1,164,472
85,082
1,386,536
—
4,921,349
Capital expenditures
232,198
925
2,850
35,686
—
271,659
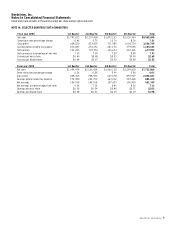
Retail
Fiscal year 2004
Stores
Credit
Direct
Other
Eliminations
Total
Net sales (a)
$6,630,764
—
$446,778
$53,846
—
$7,131,388
Net sales increase (decrease)
9.7%
N/A
31.9%
(16.9%)
N/A
10.6%
Intersegment revenues
—
$36,645
—
—
$(36,645)
—
Interest expense, net (b)
—
(23,522)
148
(54,054)
—
(77,428)
Other income (expense) including
finance charges, net
(10,717)
202,359
(208)
(18,492)
—
172,942
Depreciation and amortization
209,321
1,107
4,395
49,946
—
264,769
Earnings before income tax expense
820,571
39,503
70,046
(282,839)
—
647,281
Earnings before income tax expense
as a percentage of net sales
12.4%
N/A
15.7%
N/A
N/A
9.1%
Goodwill
8,462
—
15,716
27,536
—
51,714
Acquired tradename
—
—
—
84,000
—
84,000
Assets (c)
2,258,762
1,030,941
103,961
1,211,726
—
4,605,390
Capital expenditures
207,599
605
6,196
32,451
—
246,851
(a) Net sales in Other include foreign sales of $104,101, $93,851, and $94,994 for 2006, 2005, and 2004.
(b) Interest income of $13,309, $12,374, and $5,574 for 2006, 2005, and 2004 is recorded in our Other segment as an offset to interest expense, net.
(c) Assets in Other include foreign assets of $211,802, $204,865, and $207,095 at the end of 2006, 2005, and 2004. It also includes unallocated assets in corporate headquarters,
consisting primarily of cash, land, buildings and equipment, and deferred tax assets.