Nordstrom 2006 Annual Report Download - page 36
Download and view the complete annual report
Please find page 36 of the 2006 Nordstrom annual report below. You can navigate through the pages in the report by either clicking on the pages listed below, or by using the keyword search tool below to find specific information within the annual report.-
 1
1 -
2
-
3
-
4
-
5
-
6
-
7
-
8
-
9
-
10
-
11
-
12
-
13
-
14
-
15
-
16
-
17
-
18
-
19
-
20
-
21
-
22
-
23
-
24
-
25
-
 26
26 -
 27
27 -
 28
28 -
 29
29 -
 30
30 -
 31
31 -
 32
32 -
 33
33 -
 34
34 -
 35
35 -
 36
36 -
 37
37 -
 38
38 -
 39
39 -
 40
40 -
 41
41 -
 42
42 -
 43
43 -
 44
44 -
 45
45 -
 46
46 -
47
-
48
-
49
-
50
-
51
-
52
-
53
-
54
-
55
-
56
-
57
-
58
-
59
-
60
-
61
-
62
-
63
-
64
-
65
-
66
-
67
-
68
-
69
-
70
-
71
-
72
-
73
-
74
-
75
-
76
-
77
-
78
-
79
-
80
-
81
-
82
-
83
-
84
-
85
-
86
 |
 |

18
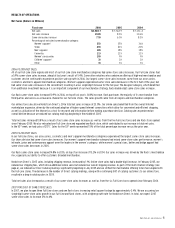
Income Tax Expense (Dollars in Millions)
Fiscal year
2006
2005
2004
Income tax expense
$427.7
$333.9
$253.8
Effective tax rate
38.7%
37.7%
39.2%
2006 VS 2005 INCOME TAX EXPENSE
Our expected effective tax rate, considering the federal tax rate of 35.0% and the net effect of state income taxes, is 38.5%. Our actual effective tax
rate was slightly higher than our expected rate because our estimates of the taxes due for prior years increased based on recent developments.
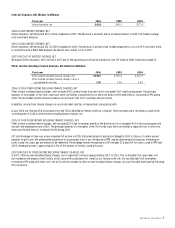
2005 VS 2004 INCOME TAX EXPENSE
In 2005, our actual effective tax rate was below our expected 38.5% because our 2004 tax expense, which was finalized in the third quarter of 2005,
was less than we planned; we reduced our reserve when the audits of our 2000 and 2001 federal tax returns were completed; and, we utilized a larger
than previously estimated amount of our capital loss carryforward.
2007 FORECAST OF INCOME TAX EXPENSE
In 2007, we expect our effective tax rate to be 38.5%.
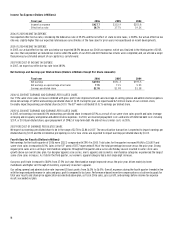
Net Earnings and Earnings per Diluted Share (Dollars in Millions Except Per Share Amounts)
Fiscal year
2006
2005
2004
Net earnings
$678.0
$551.3
$393.5
Net earnings as a percentage of net sales
7.9%
7.1%
5.5%
Earnings per diluted share
$2.55
$1.98
$1.38
2006 VS 2005 NET EARNINGS AND EARNINGS PER DILUTED SHARE
Our 7.5% same-store sales increase combined with gross profit rate improvement and sales leverage on selling, general and administrative expenses
drove net earnings of $678.0 and earnings per diluted share of $2.55. During the year, we repurchased 16.5 million shares of our common stock,
favorably impacting earnings per diluted share by $0.10. The 53rd week contributed $0.02 to earnings per diluted share.
2005 VS 2004 NET EARNINGS AND EARNINGS PER DILUTED SHARE
In 2005, net earnings increased 40.1% and earnings per diluted share increased 43.5% as a result of our same-store sales growth and sales leverage
on buying and occupancy and general and administrative expenses. In 2004, we incurred prepayment costs and wrote off deferred debt costs totaling
$20.9, or $0.05 per diluted share, upon prepayment of $198.2 of long-term debt. We did not incur similar costs in 2005.
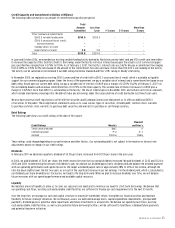
2007 FORECAST OF EARNINGS PER DILUTED SHARE
We expect our earnings per diluted share to be in the range of $2.78 to $2.84 in 2007. The securitization transaction is expected to impact earnings per
diluted share by $0.05 and the incremental pre-opening costs for new stores are expected to impact earnings per diluted share by $0.03.
Fourth Quarter Results (Dollars in Millions)
Net earnings for the fourth quarter of 2006 were $232.3 compared with $190.4 in 2005. Total sales for the quarter increased 14.6% to $2,630.9 and
same-store sales increased by 8.3%. Sales in the 53rd week of $117.7 represented 5.1% of the total percentage increase versus the prior year. Strong
regular price sales across all major merchandise categories throughout the quarter and a successful holiday season resulted in same-store sales
growth above our overall sales plan. Our designer apparel, accessories, men’s apparel, and cosmetics merchandise categories experienced the largest
same-store sales increases. As it did in the third quarter, our women’s apparel category had a mid-single digit increase.
Our gross profit rate increased to 38.3% from 37.5% last year. Merchandise margin improved versus the prior year, driven mainly by lower
markdowns and higher sell-through of inventory, especially in women’s apparel.
Our selling, general and administrative rate improved 20 basis points from 26.2% to 26.0%. Overall, expenses during the fourth quarter trended in line
with the improved performance in sales and gross profit compared to last year. Performance-based incentive compensation costs driven by goals for
total year results and share price appreciation accelerated above plan, as fiscal 2006 sales, gross profit, and earnings before income tax expense
results exceeded our plan.