Nordstrom 2006 Annual Report Download - page 34
Download and view the complete annual report
Please find page 34 of the 2006 Nordstrom annual report below. You can navigate through the pages in the report by either clicking on the pages listed below, or by using the keyword search tool below to find specific information within the annual report.-
 1
1 -
2
-
3
-
4
-
5
-
6
-
7
-
8
-
9
-
10
-
11
-
12
-
13
-
14
-
15
-
16
-
17
-
18
-
19
-
20
-
21
-
22
-
23
-
 24
24 -
 25
25 -
 26
26 -
 27
27 -
 28
28 -
 29
29 -
 30
30 -
 31
31 -
 32
32 -
 33
33 -
 34
34 -
 35
35 -
 36
36 -
 37
37 -
 38
38 -
 39
39 -
 40
40 -
 41
41 -
 42
42 -
 43
43 -
 44
44 -
45
-
46
-
47
-
48
-
49
-
50
-
51
-
52
-
53
-
54
-
55
-
56
-
57
-
58
-
59
-
60
-
61
-
62
-
63
-
64
-
65
-
66
-
67
-
68
-
69
-
70
-
71
-
72
-
73
-
74
-
75
-
76
-
77
-
78
-
79
-
80
-
81
-
82
-
83
-
84
-
85
-
86
 |
 |

16
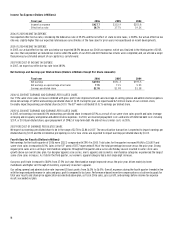
Gross Profit (Dollars in Millions Except Per Square Foot Amounts)
Fiscal year
2006
2005
2004
Gross profit
$3,206.7
$2,834.8
$2,572.0
Gross profit rate
37.5%
36.7%
36.1%
Average inventory per square foot
$52.37
$51.25
$52.46
Inventory turnover rate*
5.06
4.84
4.51
* Inventory turnover rate calculated as 5-quarter average inventory divided by annual cost of sales.
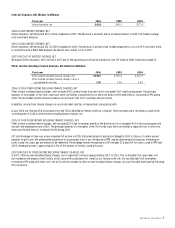
2006 VS 2005 GROSS PROFIT
Our gross profit rate improved 75 basis points, driven primarily by expansion of our merchandise margin rate. All major merchandise categories
contributed to this rate expansion, in part due to an increase of regular price merchandise sales. Our women’s apparel category experienced
significant rate expansion in the second half of the year due to strategy changes that brought a sharper focus to our merchandise offering.
For the first time, this year our buying and occupancy costs included expenses related to stock options awarded primarily to our merchant and
product development groups. These costs were $11.9 and impacted our gross profit rate by 14 basis points. Despite this additional expense,
we leveraged our buying and occupancy costs on sales growth.
Sales growth and continued inventory discipline resulted in improvement in our inventory turnover rate, which increased 4.5%.
2005 VS 2004 GROSS PROFIT
While we showed growth in our same-store sales in 2005, we held buying and occupancy costs relatively consistent with 2004. In addition,
our merchandise costs increased in-line with our sales increases. As a result, we drove a gross profit rate improvement of 60 basis points.
Our inventory turnover rate improved 7.3% in 2005, indicating that our merchandise planning and execution have continued to improve.
2007 FORECAST OF GROSS PROFIT
In 2007, if we achieve our planned same-store sales growth, we expect a net 30 to 40 basis point improvement in our gross profit rate from continued sales
leverage on buying and occupancy costs along with improved merchandise margin.
Selling, General and Administrative Expenses (Dollars in Millions)
Fiscal year
2006
2005
2004
Selling, general and administrative expenses
$2,296.9
$2,100.7
$2,020.2
Selling, general and administrative rate
26.8%
27.2%
28.3%
2006 VS 2005 SELLING, GENERAL AND ADMINISTRATIVE EXPENSES
We expect our selling, general and administrative rate to decrease when sales increase as we gain leverage on our fixed overhead costs. This rate
decreased in 2006, but the decrease was less than the 2005 improvement. In 2005, our selling, general, and administrative rate was reduced by 24
basis points for favorable developments in our workers’ compensation reserve. In 2006, our selling, general and administrative rate was unfavorably
impacted by 20 basis points for new stock option expenses from the adoption of Statement No. 123(R),
Share-Based Payment
(“SFAS 123(R)”).
2005 VS 2004 SELLING, GENERAL AND ADMINISTRATIVE EXPENSES
The primary component of our selling, general and administrative expenses that varies with our same-store sales is our selling costs. Most of
our other expenses do not fluctuate with changes in our same-store sales. In 2005, as our same-store sales increased 6.0%, our general and
administrative expenses were essentially in-line with 2004 and we benefited from a favorable adjustment to our workers’ compensation reserve.
These factors combined to give us a 110 basis point decrease in our selling, general and administrative rate.
2007 FORECAST OF SELLING, GENERAL AND ADMINISTRATIVE EXPENSES
In 2007, our selling, general and administrative rate is expected to increase by 5 to 15 basis points due to the impact of an upcoming securitization
transaction (see Off-Balance Sheet Financing on page 21) and incremental new store pre-opening costs (see Investing Activities on page 20). These
two factors, which are expected to increase our selling, general and administrative expenses by $37 to $47, or 45 to 55 basis points, will offset the
expected 35 to 45 basis points of rate improvement from additional sales leverage on fixed overhead costs.