Nordstrom 2006 Annual Report Download - page 33
Download and view the complete annual report
Please find page 33 of the 2006 Nordstrom annual report below. You can navigate through the pages in the report by either clicking on the pages listed below, or by using the keyword search tool below to find specific information within the annual report.-
 1
1 -
2
-
3
-
4
-
5
-
6
-
7
-
8
-
9
-
10
-
11
-
12
-
13
-
14
-
15
-
16
-
17
-
18
-
19
-
20
-
21
-
22
-
 23
23 -
 24
24 -
 25
25 -
 26
26 -
 27
27 -
 28
28 -
 29
29 -
 30
30 -
 31
31 -
 32
32 -
 33
33 -
 34
34 -
 35
35 -
 36
36 -
 37
37 -
 38
38 -
 39
39 -
 40
40 -
 41
41 -
 42
42 -
 43
43 -
44
-
45
-
46
-
47
-
48
-
49
-
50
-
51
-
52
-
53
-
54
-
55
-
56
-
57
-
58
-
59
-
60
-
61
-
62
-
63
-
64
-
65
-
66
-
67
-
68
-
69
-
70
-
71
-
72
-
73
-
74
-
75
-
76
-
77
-
78
-
79
-
80
-
81
-
82
-
83
-
84
-
85
-
86
 |
 |

Nordstrom, Inc. and subsidiaries 15
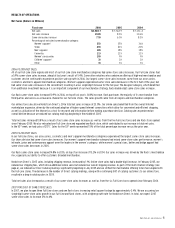
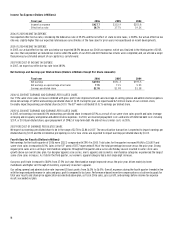
RESULTS OF OPERATIONS
Net Sales (Dollars in Millions)
Fiscal year
2006
2005
2004
Net sales
$8,560.7
$7,722.9
$7,131.4
Net sales increase
10.8%
8.3%
10.6%
Same-store sales increase
7.5%
6.0%
8.5%
Percentage of net sales by merchandise category:
Women’s apparel
35%
35%
36%
Shoes
20%
21%
20%
Men’s apparel
18%
18%
18%
Cosmetics
11%
11%
11%
Women’s accessories
10%
9%
9%
Children’s apparel
3%
3%
3%
Other
3%
3%
3%
2006 VS 2005 NET SALES
All of our Full-Line store regions and most of our Full-Line store merchandise categories had same-store sales increases. Our Full-Line stores had
a 5.9% same-store sales increase, ahead of last year’s result of 5.4%. Some other retailers who combine an offering of high-end merchandise and
customer service continued to experience positive sales growth in 2006. Our largest same-store sales increases came from our accessories,
cosmetics and men’s apparel merchandise categories. Women’s apparel experienced same-store sales decreases in the first half of the year, but
had same-store sales increases in the second half, resulting in a low single digit increase for the full year. The designer category, which benefited
from additional investment because it is an important component of our merchandise strategy, had a double-digit same-store sales increase.
Our Rack same-store sales increased 10.9% in 2006, on top of last year’s 14.8% increase. Rack purchases the majority of its merchandise from
third-parties and serves as a clearance channel for our Full-Line stores. The sales growth came from all regions and merchandise categories.
Our online store sales drove Nordstrom Direct’s 2006 total net sales increase of 23.0%. Our online sales benefited from the overall Internet
marketplace expansion, driven by the continued adoption of higher-speed Internet connections which allow for convenient and efficient shopping,
as well as utilization of the Internet as a tool for research and information before making a purchase decision. Catalog sales experienced an
overall decline because we reduced our catalog mailings beginning in the middle of 2005.
Total net sales increased 10.8% as a result of our same-store sales increases as well as from the five Full-Line stores and one Rack store opened
since February 2005. We also relocated one Full-Line store and expanded one Rack store, which contributed to our increase in total net sales.
In the 53rd week, we had sales of $117.7. Sales for the 53rd week represented 1.5% of the total percentage increase versus the prior year.
2005 VS 2004 NET SALES
In our Full-Line stores, our accessories, cosmetics and men’s apparel merchandise categories experienced the largest same-store sales increases.
Our shoes division had same-store sales increases. Our women’s apparel merchandise category had mixed same-store sales performance; women’s
intimate, junior and contemporary apparel were the leaders in the women’s category, while women’s special sizes, better and bridge apparel had
same-store sales decreases in 2005.
Our Rack same-store sales increased 14.8% in 2005, on top of an increase of 13.2% in 2004. Our sales increase was driven by the Rack’s merchandise
mix, especially our ability to offer customers branded merchandise.
Nordstrom Direct’s 2005 sales, including shipping revenue, increased by 1.1%. Online store sales had a double-digit increase. In February 2005, we
reduced our shipping fees, which drove additional online sales but reduced our overall shipping revenue. As part of the multi-channel strategy (see
page 6), we reduced our Direct catalog mailings significantly beginning in July 2005 and we shifted the merchandise offering to be more aligned with
the Full-Line stores. The decrease in the number of Direct catalog mailings, along with a continuing shift of catalog customers to our online store,
resulted in a drop in catalog sales in 2005.
Total net sales also increased as a result of our same-store sales increases as well as from the six Full-Line stores opened since February 2004.
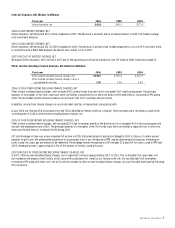
2007 FORECAST OF SAME-STORE SALES
In 2007, we plan to open three Full-Line stores and one Rack store, increasing retail square footage by approximately 2.4%. We are assuming low
single digit same-store sales growth in our Full-Line and Rack stores, with a higher growth rate for Nordstrom Direct. In total, we expect 2007
same-store sales to increase 3% to 4%.