Nordstrom 2006 Annual Report Download - page 50
Download and view the complete annual report
Please find page 50 of the 2006 Nordstrom annual report below. You can navigate through the pages in the report by either clicking on the pages listed below, or by using the keyword search tool below to find specific information within the annual report.-
 1
1 -
2
-
3
-
4
-
5
-
6
-
7
-
8
-
9
-
10
-
11
-
12
-
13
-
14
-
15
-
16
-
17
-
18
-
19
-
20
-
21
-
22
-
23
-
24
-
25
-
26
-
27
-
28
-
29
-
30
-
31
-
32
-
33
-
34
-
35
-
36
-
37
-
38
-
39
-
 40
40 -
 41
41 -
 42
42 -
 43
43 -
 44
44 -
 45
45 -
 46
46 -
 47
47 -
 48
48 -
 49
49 -
 50
50 -
 51
51 -
 52
52 -
 53
53 -
 54
54 -
 55
55 -
 56
56 -
 57
57 -
 58
58 -
 59
59 -
 60
60 -
61
-
62
-
63
-
64
-
65
-
66
-
67
-
68
-
69
-
70
-
71
-
72
-
73
-
74
-
75
-
76
-
77
-
78
-
79
-
80
-
81
-
82
-
83
-
84
-
85
-
86
 |
 |

32
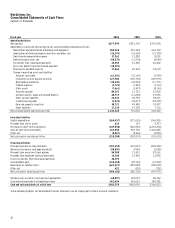
Nordstrom, Inc.
Consolidated Statements of Cash Flows
Amounts in thousands
Fiscal year
2006
2005
2004
Operating Activities
Net earnings
$677,999
$551,339
$393,450
Adjustments to reconcile net earnings to net cash provided by operating activities:
Depreciation and amortization of buildings and equipment
284,520
276,328
264,769
Amortization of deferred property incentives and other, net
(36,293)
(33,350)
(31,378)
Stock-based compensation expense
37,362
13,285
8,051
Deferred income taxes, net
(58,274)
(11,238)
(8,040)
Tax benefit from stock-based payments
43,552
41,092
25,442
Excess tax benefit from stock-based payments
(38,293)
—
—
Provision for bad debt expense
17,064
20,918
24,639
Change in operating assets and liabilities:
Accounts receivable
(61,301)
(15,140)
(2,950)
Investment in asset backed securities
127,984
(135,790)
(149,970)
Merchandise inventories
(38,649)
(20,804)
(11,771)
Prepaid expenses
(4,723)
(1,035)
(3,163)
Other assets
(7,661)
(3,473)
(8,143)
Accounts payable
84,291
31,721
23,930
Accrued salaries, wages and related benefits
48,719
(11,284)
15,055
Other current liabilities
23,533
38,755
58,471
Income taxes payable
(5,522)
(33,877)
(18,999)
Deferred property incentives
30,723
49,480
19,837
Other liabilities
17,334
19,305
7,116
Net cash provided by operating activities
1,142,365
776,232
606,346
Investing Activities
Capital expenditures
(264,437)
(271,659)
(246,851)
Proceeds from sale of assets
224
107
5,473
Purchases of short-term investments
(109,550)
(542,925)
(3,232,250)
Sales of short-term investments
163,550
530,750
3,366,425
Other, net
(8,067)
(8,366)
(2,830)
Net cash used in investing activities
(218,280)
(292,093)
(110,033)
Financing Activities
Principal payments on long-term debt
(307,559)
(101,047)
(205,252)
(Decrease) increase in cash book overdrafts
(50,853)
4,946
(2,680)
Proceeds from exercise of stock options
50,900
73,023
87,061
Proceeds from employee stock purchase plan
16,300
15,600
12,892
Excess tax benefit from stock-based payments
38,293
—
—
Cash dividends paid
(110,158)
(87,196)
(67,240)
Repurchase of common stock
(621,527)
(287,080)
(300,000)
Other, net
422
(352)
(752)
Net cash used in financing activities
(984,182)
(382,106)
(475,971)
Net (decrease) increase in cash and cash equivalents
(60,097)
102,033
20,342
Cash and cash equivalents at beginning of year
462,656
360,623
340,281
Cash and cash equivalents at end of year
$402,559
$462,656
$360,623
The accompanying Notes to Consolidated Financial Statements are an integral part of these financial statements.