Nordstrom 2006 Annual Report Download - page 31
Download and view the complete annual report
Please find page 31 of the 2006 Nordstrom annual report below. You can navigate through the pages in the report by either clicking on the pages listed below, or by using the keyword search tool below to find specific information within the annual report.-
 1
1 -
2
-
3
-
4
-
5
-
6
-
7
-
8
-
9
-
10
-
11
-
12
-
13
-
14
-
15
-
16
-
17
-
18
-
19
-
20
-
 21
21 -
 22
22 -
 23
23 -
 24
24 -
 25
25 -
 26
26 -
 27
27 -
 28
28 -
 29
29 -
 30
30 -
 31
31 -
 32
32 -
 33
33 -
 34
34 -
 35
35 -
 36
36 -
 37
37 -
 38
38 -
 39
39 -
 40
40 -
 41
41 -
42
-
43
-
44
-
45
-
46
-
47
-
48
-
49
-
50
-
51
-
52
-
53
-
54
-
55
-
56
-
57
-
58
-
59
-
60
-
61
-
62
-
63
-
64
-
65
-
66
-
67
-
68
-
69
-
70
-
71
-
72
-
73
-
74
-
75
-
76
-
77
-
78
-
79
-
80
-
81
-
82
-
83
-
84
-
85
-
86
 |
 |

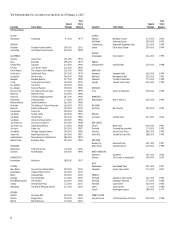
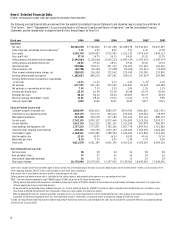
Nordstrom, Inc. and subsidiaries 13
(Dollars in thousands except sales per square foot and per share amounts)
Fiscal year
20004
19995
1998
1997
1996
Operations
Net sales
$5,511,908
$5,144,754
$5,049,182
$4,864,604
$4,457,931
Same-store sales percentage increase (decrease)1
0.3%
(1.1%)
(2.7%)
4.0%
0.6%
Gross profit
1,854,220
1,781,929
1,704,237
1,568,791
1,378,472
Gross profit rate2
33.6%
34.6%
33.8%
32.2%
30.9%
Selling, general, and administrative expenses
(1,722,247)
(1,516,259)
(1,429,837)
(1,338,235)
(1,232,860)
Selling, general, and administrative rate3
31.2%
29.5%
28.3%
27.5%
27.7%
Operating income
131,973
265,670
274,400
230,556
145,612
Interest expense, net
(62,698)
(50,396)
(47,091)
(34,250)
(39,400)
Other income including finance charges, net
130,600
116,783
110,414
110,907
135,331
Earnings before income tax expense
167,018
332,057
337,723
307,213
241,543
Earnings before income tax expense as a percentage of
net sales
3.0%
6.5%
6.7%
6.3%
5.4%
Net earnings
101,918
202,557
206,723
186,213
146,316
Net earnings as a percentage of net sales
1.8%
3.9%
4.1%
3.8%
3.3%
Earnings per diluted share
$0.39
$0.73
$0.70
$0.60
$0.45
Dividends per share
$0.175
$0.16
$0.15
$0.1325
$0.125
Return on average shareholders’ equity
8.4%
16.3%
15.0%
12.8%
10.2%
Sales per square foot
$341
$349
$362
$384
$377
Financial Position (at year end)
Customer accounts receivable, net
$649,504
$557,190
$560,564
$621,704
$661,332
Investment in asset backed securities
50,183
38,830
7,097
20,158
31,791
Merchandise inventories
945,687
797,845
750,269
826,045
719,919
Current assets
1,812,982
1,564,648
1,668,689
1,613,492
1,549,819
Current liabilities
950,568
866,509
794,490
979,031
795,321
Land, buildings and equipment, net
1,599,938
1,429,492
1,378,006
1,252,513
1,152,454
Long-term debt, including current portion
1,112,296
804,982
868,234
420,865
380,632
Shareholders’ equity
1,233,445
1,185,614
1,300,545
1,458,950
1,457,084
Debt-to-capital ratio
49.2%
42.5%
42.1%
31.9%
27.2%
Book value per share
4.61
4.48
4.58
4.78
4.57
Total assets
3,608,503
3,062,081
3,103,689
2,890,664
2,726,495
Store Information (at year end)
Full-Line stores
77
71
67
65
62
Rack and other stores
43
33
30
27
21
International Façonnable boutiques
20
0
0
0
0
Total square footage
16,056,000
14,487,000
13,593,000
12,614,000
11,754,000
1Same-stores include stores that have been open at least one full year at the beginning of the year.
2Gross profit rate is calculated as the gross profit as a percentage of net sales.
3Selling, general, and administrative rate is calculated as the selling, general, and administrative expenses as a percentage of net sales.
42000 - The items below amounted to a net $56,084 charge ($34,211, net of tax, or $0.13 per diluted share):
• Selling, general and administrative expenses included a charge of $13,000 for certain severance and other costs related to a change in management.
• We recorded an impairment charge of $10,227, consisting of $9,627 recorded in selling, general and administrative expenses and $600 in interest expense, related to several
software projects under development that were either impaired or obsolete.
• We held common shares in Streamline, Inc., an Internet grocery and consumer goods delivery company. Streamline ceased its operations effective November 2000, and we
wrote off our entire investment of $32,857 in Streamline.
51999 - The item below amounted to a net $10,000 charge ($6,111, net of tax, or $0.02 per diluted share):
• Selling, general and administrative expenses included a charge of $10,000 primarily associated with the restructuring of our information technology services area. The charge
consisted of $4,053 in the disposition of several software projects under development, $2,685 in employee severance and $1,206 in other miscellaneous costs. Additionally,
we recorded $2,056 related to settlement costs for two lawsuits.