Nordstrom 2006 Annual Report Download - page 47
Download and view the complete annual report
Please find page 47 of the 2006 Nordstrom annual report below. You can navigate through the pages in the report by either clicking on the pages listed below, or by using the keyword search tool below to find specific information within the annual report.-
 1
1 -
2
-
3
-
4
-
5
-
6
-
7
-
8
-
9
-
10
-
11
-
12
-
13
-
14
-
15
-
16
-
17
-
18
-
19
-
20
-
21
-
22
-
23
-
24
-
25
-
26
-
27
-
28
-
29
-
30
-
31
-
32
-
33
-
34
-
35
-
36
-
 37
37 -
 38
38 -
 39
39 -
 40
40 -
 41
41 -
 42
42 -
 43
43 -
 44
44 -
 45
45 -
 46
46 -
 47
47 -
 48
48 -
 49
49 -
 50
50 -
 51
51 -
 52
52 -
 53
53 -
 54
54 -
 55
55 -
 56
56 -
 57
57 -
58
-
59
-
60
-
61
-
62
-
63
-
64
-
65
-
66
-
67
-
68
-
69
-
70
-
71
-
72
-
73
-
74
-
75
-
76
-
77
-
78
-
79
-
80
-
81
-
82
-
83
-
84
-
85
-
86
 |
 |

Nordstrom, Inc. and subsidiaries 29
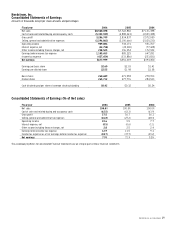
Nordstrom, Inc.
Consolidated Statements of Earnings
Amounts in thousands except per share amounts and percentages
Fiscal year
2006
2005
2004
Net sales
$8,560,698
$7,722,860
$7,131,388
Cost of sales and related buying and occupancy costs
(5,353,949)
(4,888,023)
(4,559,388)
Gross profit
3,206,749
2,834,837
2,572,000
Selling, general and administrative expenses
(2,296,863)
(2,100,666)
(2,020,233)
Operating income
909,886
734,171
551,767
Interest expense, net
(42,758)
(45,300)
(77,428)
Other income including finance charges, net
238,525
196,354
172,942
Earnings before income tax expense
1,105,653
885,225
647,281
Income tax expense
(427,654)
(333,886)
(253,831)
Net earnings
$677,999
$551,339
$393,450
Earnings per basic share
$2.60
$2.03
$1.41
Earnings per diluted share
$2.55
$1.98
$1.38
Basic shares
260,689
271,958
278,993
Diluted shares
265,712
277,776
284,533
Cash dividends paid per share of common stock outstanding
$0.42
$0.32
$0.24
Consolidated Statements of Earnings (% of Net sales)
Fiscal year
2006
2005
2004
Net sales
100.0%
100.0%
100.0%
Cost of sales and related buying and occupancy costs
(62.5)
(63.3)
(63.9)
Gross profit
37.5
36.7
36.1
Selling, general and administrative expenses
(26.8)
(27.2)
(28.3)
Operating income
10.6
9.5
7.7
Interest expense, net
(0.5)
(0.6)
(1.1)
Other income including finance charges, net
2.8
2.5
2.4
Earnings before income tax expense
12.9
11.5
9.1
Income tax expense (as a % of earnings before income tax expense)
(38.7)
(37.7)
(39.2)
Net earnings
7.9%
7.1%
5.5%
The accompanying Notes to Consolidated Financial Statements are an integral part of these financial statements.