Nordstrom 2006 Annual Report Download - page 59
Download and view the complete annual report
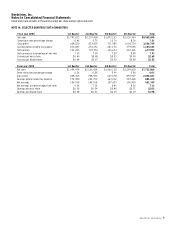
Please find page 59 of the 2006 Nordstrom annual report below. You can navigate through the pages in the report by either clicking on the pages listed below, or by using the keyword search tool below to find specific information within the annual report.
Nordstrom, Inc. and subsidiaries 41
Nordstrom, Inc.
Notes to Consolidated Financial Statements
Dollar and share amounts in thousands except per share and per option amounts
NOTE 6: INCOME TAXES
Income tax expense consists of the following:
Fiscal year
2006
2005
2004
Current income taxes:
Federal
$423,143
$311,996
$282,430
State and local
62,785
38,100
45,091
Total current income tax expense
485,928
350,096
327,521
Deferred income taxes:
Current
(10,477)
(7,208)
(15,259)
Non-current
(47,797)
(9,002)
(58,431)
Total deferred income tax benefit
(58,274)
(16,210)
(73,690)
Total income tax expense
$427,654
$333,886
$253,831
A reconciliation of the statutory Federal income tax rate to the effective tax rate on earnings before income tax expense is as follows:
Fiscal year
2006
2005
2004
Statutory rate
35.0%
35.0%
35.0%
State and local income taxes, net of federal
income taxes
3.2
3.2
3.5
Change in valuation allowance
—
(0.1)
0.3
Other, net
0.5
(0.4)
0.4
Effective tax rate
38.7%
37.7%
39.2%
Deferred income taxes reflect the net tax effect of temporary differences between amounts recorded for financial reporting purposes and amounts
used for tax purposes. The major components of deferred tax assets and liabilities are as follows:
February 3, 2007
January 28, 2006
Compensation and benefits accruals
$85,638
$70,454
Accrued expenses
52,630
53,629
Merchandise inventories
24,964
23,206
Securitization
23,767
7,892
Land, buildings and equipment basis and
depreciation differences
14,613
—
Gift cards and gift certificates
13,668
13,041
Merchandise certificates
8,615
5,524
Bad debts
6,477
5,528
Other
—
1,581
Total deferred tax assets
230,372
180,855
Land, buildings and equipment basis and
depreciation differences
—
(16,892)
Other
(8,423)
(8,720)
Total deferred tax liabilities
(8,423)
(25,612)
Net deferred tax assets
$221,949
$155,243
NOTE 7: LONG-TERM DEBT
A summary of long-term debt is as follows:
Februarys 3, 2007
January 28, 2006
Senior debentures, 6.95%, due March 2028
$300,000
$300,000
Senior notes, 5.625%, due January 2009
250,000
250,000
Private Label Securitization, 4.82%, due October 2006
—
300,000
Mortgage payable, 7.68%, due April 2020
69,710
72,633
Other
19,600
22,811
Fair market value of interest rate swap
(8,858)
(11,050)
Total long–term debt
630,452
934,394
Less current portion
(6,800)
(306,618)
Total due beyond one year
$623,652
$627,776


