Nordstrom 2006 Annual Report Download - page 30
Download and view the complete annual report
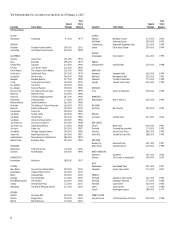
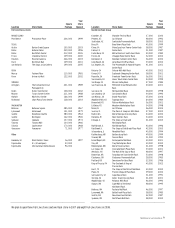
Please find page 30 of the 2006 Nordstrom annual report below. You can navigate through the pages in the report by either clicking on the pages listed below, or by using the keyword search tool below to find specific information within the annual report.-
 1
1 -
2
-
3
-
4
-
5
-
6
-
7
-
8
-
9
-
10
-
11
-
12
-
13
-
14
-
15
-
16
-
17
-
18
-
19
-
 20
20 -
 21
21 -
 22
22 -
 23
23 -
 24
24 -
 25
25 -
 26
26 -
 27
27 -
 28
28 -
 29
29 -
 30
30 -
 31
31 -
 32
32 -
 33
33 -
 34
34 -
 35
35 -
 36
36 -
 37
37 -
 38
38 -
 39
39 -
 40
40 -
41
-
42
-
43
-
44
-
45
-
46
-
47
-
48
-
49
-
50
-
51
-
52
-
53
-
54
-
55
-
56
-
57
-
58
-
59
-
60
-
61
-
62
-
63
-
64
-
65
-
66
-
67
-
68
-
69
-
70
-
71
-
72
-
73
-
74
-
75
-
76
-
77
-
78
-
79
-
80
-
81
-
82
-
83
-
84
-
85
-
86
 |
 |

12
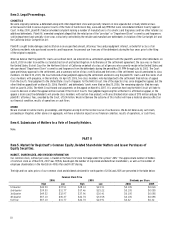
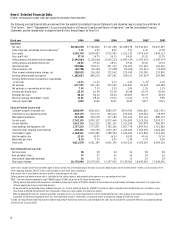
Item 6. Selected Financial Data.
(Dollars in thousands except sales per square foot and per share amounts)
The following selected financial data are derived from the audited Consolidated Financial Statements and should be read in conjunction with Item 1A
“Risk Factors,” Item 7 “Management’s Discussion and Analysis of Financial Condition and Results of Operation,” and the Consolidated Financial
Statements and the related notes included in Item 8 of this Annual Report on Form 10-K.
Fiscal year
2006
2005
2004
2003
20024
2001
Operations
Net sales
$8,560,698
$7,722,860
$7,131,388
$6,448,678
$5,944,656
$5,607,687
Same-store sales percentage increase (decrease)1
7.5%
6.0%
8.5%
4.1%
1.4%
(2.9%)
Gross profit
3,206,749
2,834,837
2,572,000
2,233,132
1,974,634
1,844,133
Gross profit rate2
37.5%
36.7%
36.1%
34.6%
33.2%
32.9%
Selling, general, and administrative expenses
(2,296,863)
(2,100,666)
(2,020,233)
(1,899,129)
(1,783,210)
(1,698,497)
Selling, general, and administrative rate3
26.8%
27.2%
28.3%
29.4%
30.0%
30.3%
Operating income
909,886
734,171
551,767
334,003
191,424
145,636
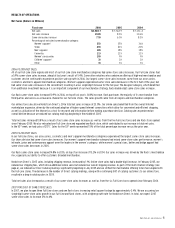
Interest expense, net
(42,758)
(45,300)
(77,428)
(90,952)
(81,921)
(75,038)
Other income including finance charges, net
238,525
196,354
172,942
155,090
139,289
133,890
Earnings before income tax expense
1,105,653
885,225
647,281
398,141
195,6245
204,488
Earnings before income tax expense as a percentage
of net sales
12.9%
11.5%
9.1%
6.2%
3.3%5
3.6%
Net earnings
677,999
551,339
393,450
242,841
90,224
124,688
Net earnings as a percentage of net sales
7.9%
7.1%
5.5%
3.8%
1.5%
2.2%
Earnings per diluted share
$2.55
$1.98
$1.38
$0.88
$0.33
$0.46
Dividends per share
$0.42
$0.32
$0.24
$0.205
$0.19
$0.18
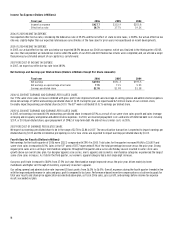
Return on average shareholders’ equity
31.8%
28.4%
23.0%
16.2%
6.7%
9.8%
Sales per square foot
$393
$369
$347
$325
$317
$319
Financial Position (at year end)
Customer accounts receivable, net
$608,599
$566,815
$580,397
$594,900
$606,861
$621,491
Investment in asset backed securities
428,175
561,136
422,416
272,294
124,543
58,539
Merchandise inventories
997,289
955,978
917,182
901,623
953,112
888,172
Current assets
2,742,193
2,874,157
2,572,444
2,524,843
2,125,356
2,095,317
Current liabilities
1,433,143
1,623,312
1,341,152
1,122,559
925,978
986,587
Land, buildings and equipment, net
1,757,215
1,773,871
1,780,366
1,807,778
1,849,961
1,761,082
Long-term debt, including current portion
630,452
934,394
1,030,107
1,234,243
1,350,595
1,424,242
Shareholders’ equity
2,168,521
2,092,681
1,788,994
1,634,009
1,372,864
1,316,245
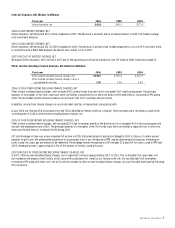
Debt-to-capital ratio
22.5%
30.9%
36.5%
43.0%
49.6%
52.0%
Book value per share
8.43
7.76
6.59
5.90
5.07
4.89
Total assets
4,821,578
4,921,349
4,605,390
4,569,233
4,185,269
4,084,356
Store Information (at year end)
Full-Line stores
98
98
94
92
88
80
Rack and other stores
57
57
56
56
55
52
International Façonnable boutiques
36
32
31
31
23
24
Total square footage
20,170,000
20,070,000
19,397,000
19,138,000
18,428,000
17,048,000
1Same-stores include stores that have been open at least one full year at the beginning of the year. Fiscal year 2006 includes an extra week (the 53rd week) as a result of our 4-5-4
retail reporting calendar. The 53rd week is not included in same-store sales calculations.
2Gross profit rate is calculated as the gross profit as a percentage of net sales.
3Selling, general, and administrative rate is calculated as the selling, general, and administrative expenses as a percentage of net sales.
42002 - The items below amounted to a net $90,638 charge ($71,041, net of tax, or $0.26 per diluted share):
• Selling, general and administrative expenses included an impairment charge of $15,570 related to the write-down of an information technology investment in a supply chain
software application in our private label business.
• We purchased the outstanding shares of Nordstrom.com, Inc. series C preferred stock for $70,000. The minority interest purchase and reintegration costs resulted in a one-
time charge of $53,168. No tax benefit was recognized as there was no possibility of a future tax benefit.
• When we adopted SFAS No. 142,
Goodwill and Other Intangible Assets
, our initial impairment test of the Façonnable Business Unit resulted in an impairment charge to acquired
tradename of $16,133 and to goodwill of $5,767. The impairment charge is reflected as a cumulative effect of accounting change ($13,359, net of tax).
5In 2002, earnings before income tax expense and earnings before income tax expense as a percentage of net sales do not include the cumulative effect of an accounting change
of $13,359, net of tax of $8,541.