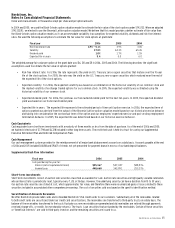
Nordstrom 2006 Annual Report Download - page 58
Download and view the complete annual report
Please find page 58 of the 2006 Nordstrom annual report below. You can navigate through the pages in the report by either clicking on the pages listed below, or by using the keyword search tool below to find specific information within the annual report.-
 1
1 -
2
-
3
-
4
-
5
-
6
-
7
-
8
-
9
-
10
-
11
-
12
-
13
-
14
-
15
-
16
-
17
-
18
-
19
-
20
-
21
-
22
-
23
-
24
-
25
-
26
-
27
-
28
-
29
-
30
-
31
-
32
-
33
-
34
-
35
-
36
-
37
-
38
-
39
-
40
-
41
-
42
-
43
-
44
-
45
-
46
-
47
-
 48
48 -
 49
49 -
 50
50 -
 51
51 -
 52
52 -
 53
53 -
 54
54 -
 55
55 -
 56
56 -
 57
57 -
 58
58 -
 59
59 -
 60
60 -
 61
61 -
 62
62 -
 63
63 -
 64
64 -
 65
65 -
 66
66 -
 67
67 -
 68
68 -
69
-
70
-
71
-
72
-
73
-
74
-
75
-
76
-
77
-
78
-
79
-
80
-
81
-
82
-
83
-
84
-
85
-
86
 |
 |

40
Nordstrom, Inc.
Notes to Consolidated Financial Statements
Dollar and share amounts in thousands except per share and per option amounts
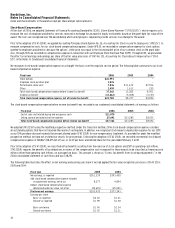
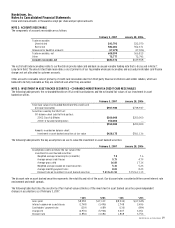
These sensitivities are hypothetical and should be used with caution. The effect of an adverse change in a particular assumption on the fair
value of the investment in asset backed securities is calculated without changing any other assumption. Actual changes in one factor may
result in changes in another, which might alter the reported sensitivities.
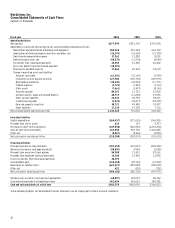
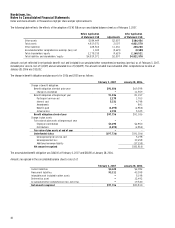
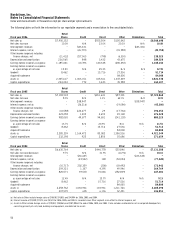
The following table summarizes certain income, expenses and cash flows received from and paid to the VISA Trust:
Fiscal year
2006
2005
2004
Principal collections reinvested in new receivables
$3,094,208
$2,597,499
$2,019,162
Gains on sales of receivables
19,732
19,902
8,876
Income earned on beneficial interests
75,065
54,396
46,645
Cash flows from beneficial interests:
Investment in asset backed securities
494,212
129,879
76,381
Servicing fees
16,189
13,309
10,698
Net credit losses were $22,476, $25,386, and $23,169 for 2006, 2005, and 2004, and receivables past due for more than 30 days were $15,560 and
$10,059 at the end of 2006 and 2005.
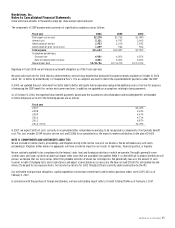
The following table illustrates default projections using net credit losses as a percentage of average outstanding receivables in comparison to
actual performance:
Fiscal year
2007
2006
2005
Original projection
2.83%
3.46%
4.04%
Actual
N/A
2.76%
3.76%
Our continued involvement in the securitization of co-branded Nordstrom VISA credit card receivables includes recording gains/losses on sales,
recognizing income on investment in asset backed securities, holding subordinated, non-subordinated and residual interests in the trust, and servicing
the portfolio.
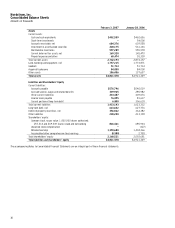
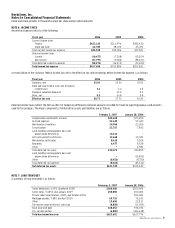
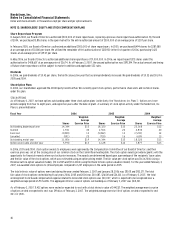
NOTE 4: LAND, BUILDINGS AND EQUIPMENT
Land, buildings and equipment consist of the following:
February 3, 2007
January 28, 2006
Land and land improvements
$65,137
$67,020
Buildings and building improvements
812,074
796,686
Leasehold improvements
1,269,176
1,190,041
Store fixtures and equipment
1,984,041
1,919,200
Software
285,341
265,951
Construction in progress
131,561
84,532
4,547,330
4,323,430
Less accumulated depreciation and amortization
(2,790,115)
(2,549,559)
Land, buildings and equipment, net
$1,757,215
$1,773,871
The total cost of buildings and equipment held under capital lease obligations was $20,035 at the end of 2006 and 2005, with related accumulated
amortization of $16,595 and $16,089. The amortization of capitalized leased buildings and equipment of $506, $830, and $1,238 in 2006, 2005, and 2004
was recorded in depreciation expense.
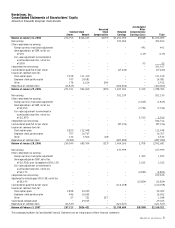
NOTE 5: EMPLOYEE BENEFITS
We provide a 401(k) and profit sharing plan for our employees. Our Board of Directors establishes our profit sharing contribution each year.
The 401(k) component is funded by voluntary employee contributions and our matching contributions up to a fixed percentage of employee
contributions. Our expense related to the profit sharing component and matching contributions to the 401(k) component totaled $73,261, $67,088,
and $54,186 in 2006, 2005, and 2004.