NetFlix 2012 Annual Report Download - page 64
Download and view the complete annual report
Please find page 64 of the 2012 NetFlix annual report below. You can navigate through the pages in the report by either clicking on the pages listed below, or by using the keyword search tool below to find specific information within the annual report.-
 1
1 -
2
-
3
-
4
-
5
-
6
-
7
-
8
-
9
-
10
-
11
-
12
-
13
-
14
-
15
-
16
-
17
-
18
-
19
-
20
-
21
-
22
-
23
-
24
-
25
-
26
-
27
-
28
-
29
-
30
-
31
-
32
-
33
-
34
-
35
-
36
-
37
-
38
-
39
-
40
-
41
-
42
-
43
-
44
-
45
-
46
-
47
-
48
-
49
-
50
-
51
-
52
-
53
-
 54
54 -
 55
55 -
 56
56 -
 57
57 -
 58
58 -
 59
59 -
 60
60 -
 61
61 -
 62
62 -
 63
63 -
 64
64 -
 65
65 -
 66
66 -
 67
67 -
 68
68 -
 69
69 -
 70
70 -
 71
71 -
 72
72 -
 73
73 -
 74
74 -
75
-
76
-
77
-
78
-
79
-
80
-
81
-
82
-
83
-
84
-
85
-
86
-
87
-
88
 |
 |

stock. Shares formally or constructively retired are deducted from common stock for par value and from
additional paid-in capital for the excess over par value. If additional paid in capital has been exhausted, the
excess over par value is deducted from Retained earnings. Direct costs incurred to acquire the shares are included
in the total cost of the shares.
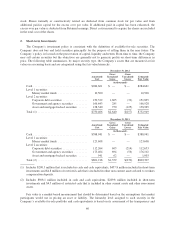
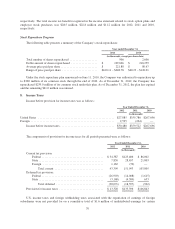
2. Short-term Investments
The Company’s investment policy is consistent with the definition of available-for-sale securities. The
Company does not buy and hold securities principally for the purpose of selling them in the near future. The
Company’s policy is focused on the preservation of capital, liquidity and return. From time to time, the Company
may sell certain securities but the objectives are generally not to generate profits on short-term differences in
price. The following table summarizes, by major security type, the Company’s assets that are measured at fair
value on a recurring basis and are categorized using the fair value hierarchy.
December 31, 2012
Amortized
Cost
Gross
Unrealized
Gains
Gross
Unrealized
Losses
Estimated
Fair Value
(in thousands)
Cash ..................................... $284,661 $ — $ — $284,661
Level 1 securities:
Money market funds .................... 10,500 — — 10,500
Level 2 securities:
Corporate debt securities ................. 150,322 1,605 (32) 151,895
Government and agency securities ......... 166,643 285 — 166,928
Asset and mortgage-backed securities ...... 138,340 750 (125) 138,965
Total (1) .................................. $750,466 $2,640 $(157) $752,949
December 31, 2011
Amortized
Cost
Gross
Unrealized
Gains
Gross
Unrealized
Losses
Estimated
Fair Value
(in thousands)
Cash ..................................... $388,941 $ — $ — $388,941
Level 1 securities:
Money market funds .................... 123,608 — — 123,608
Level 2 securities:
Corporate debt securities ................. 112,264 603 (214) 112,653
Government and agency securities ......... 175,464 694 (56) 176,102
Asset and mortgage-backed securities ...... 941 62 — 1,003
Total (2) .................................. $801,218 $1,359 $(270) $802,307
(1) Includes $290.3 million that is included in cash and cash equivalents, $457.8 million included in short-term
investments and $4.8 million of restricted cash that is included in other non-current assets related to workers
compensation deposits.
(2) Includes $508.1 million included in cash and cash equivalents, $289.8 million included in short-term
investments and $4.5 million of restricted cash that is included in other current assets and other non-current
assets.
Fair value is a market-based measurement that should be determined based on the assumptions that market
participants would use in pricing an asset or liability. The hierarchy level assigned to each security in the
Company’s available-for-sale portfolio and cash equivalents is based on its assessment of the transparency and
60