NetFlix 2012 Annual Report Download - page 32
Download and view the complete annual report
Please find page 32 of the 2012 NetFlix annual report below. You can navigate through the pages in the report by either clicking on the pages listed below, or by using the keyword search tool below to find specific information within the annual report.-
 1
1 -
2
-
3
-
4
-
5
-
6
-
7
-
8
-
9
-
10
-
11
-
12
-
13
-
14
-
15
-
16
-
17
-
18
-
19
-
20
-
21
-
 22
22 -
 23
23 -
 24
24 -
 25
25 -
 26
26 -
 27
27 -
 28
28 -
 29
29 -
 30
30 -
 31
31 -
 32
32 -
 33
33 -
 34
34 -
 35
35 -
 36
36 -
 37
37 -
 38
38 -
 39
39 -
 40
40 -
 41
41 -
 42
42 -
43
-
44
-
45
-
46
-
47
-
48
-
49
-
50
-
51
-
52
-
53
-
54
-
55
-
56
-
57
-
58
-
59
-
60
-
61
-
62
-
63
-
64
-
65
-
66
-
67
-
68
-
69
-
70
-
71
-
72
-
73
-
74
-
75
-
76
-
77
-
78
-
79
-
80
-
81
-
82
-
83
-
84
-
85
-
86
-
87
-
88
 |
 |

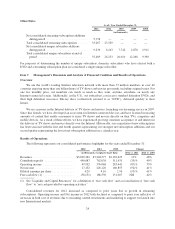
2011 Domestic Segment Results
Revenues
The $962.7 million increase in our domestic revenues in 2011 as compared to 2010 was primarily due to the
49% growth in the domestic average number of unique paying subscribers driven by new streaming
subscriptions. This increase was offset in part by a 3% decline in domestic average monthly revenue per unique
paying subscriber, resulting from the popularity of the streaming subscription plans (introduced in November
2010) and a decline in the percentage of unique paying subscribers electing both a streaming and a DVD
subscription following the pricing changes announced in July 2011.
Cost of Revenues
The $581.9 million increase in domestic cost of revenues in 2011 as compared to 2010 was due to the
following factors:
• Content acquisition and licensing expenses increased by $584.3 million. This increase was primarily
attributable to continued investments in streaming content resulting in an increase in the streaming
content available for viewing to our domestic subscribers as compared to the prior year.
• Content delivery expenses decreased $41.8 million primarily due to a 14% decrease in the number of
DVDs mailed to paying subscribers. The decrease in the number of DVDs mailed was driven by a 22%
decline in monthly DVD rentals per average paying DVD subscriber primarily attributed to the migration
of our DVD subscribers toward lower priced plans. The decrease in DVD delivery expenses was partially
offset by an increase in costs associated with our use of third-party delivery networks resulting from an
increase in the total number of hours of streaming content viewed by our subscribers.
• Other costs increased due to a $28.9 million increase in credit card fees as a result of the growth in
revenues, and a $19.1 million increase in costs associated with customer service call centers to support
our growing subscriber population. These increases were partially offset by an $8.6 million decrease in
expenses related to content processing due primarily to the 14% decrease in the number of DVDs mailed
to paying subscribers.
Marketing
Marketing expenses increased $39.2 million in 2011 as compared to 2010 primarily due to an increase in
marketing program spending in television, radio and online advertising coupled with an increase in payments to
our affiliates. These increases were partially offset by a decrease in direct mail and inserts, and payments made to
our consumer electronic partners. The increase in marketing program spending was partially offset by decreases
in the costs of free trials.
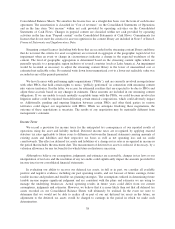
International Streaming Segment
As of /Year Ended December 31, Change
2012 2011 2012 vs. 2011
(in thousands, except percentages)
Subscriptions:
Net additions ............................... 4,263 1,349 216%
Subscriptions at end of period ................. 6,121 1,858 229%
Paid subscriptions at end of period .............. 4,892 1,447 238%
Contribution profit:
Revenues .................................. $287,542 $ 82,850 247%
Cost of revenues ............................ 475,570 107,482 342%
Marketing ................................. 201,283 78,517 156%
Contribution loss ............................ (389,311) (103,149) 277%
28