NetFlix 2012 Annual Report Download - page 34
Download and view the complete annual report
Please find page 34 of the 2012 NetFlix annual report below. You can navigate through the pages in the report by either clicking on the pages listed below, or by using the keyword search tool below to find specific information within the annual report.-
 1
1 -
2
-
3
-
4
-
5
-
6
-
7
-
8
-
9
-
10
-
11
-
12
-
13
-
14
-
15
-
16
-
17
-
18
-
19
-
20
-
21
-
22
-
23
-
 24
24 -
 25
25 -
 26
26 -
 27
27 -
 28
28 -
 29
29 -
 30
30 -
 31
31 -
 32
32 -
 33
33 -
 34
34 -
 35
35 -
 36
36 -
 37
37 -
 38
38 -
 39
39 -
 40
40 -
 41
41 -
 42
42 -
 43
43 -
 44
44 -
45
-
46
-
47
-
48
-
49
-
50
-
51
-
52
-
53
-
54
-
55
-
56
-
57
-
58
-
59
-
60
-
61
-
62
-
63
-
64
-
65
-
66
-
67
-
68
-
69
-
70
-
71
-
72
-
73
-
74
-
75
-
76
-
77
-
78
-
79
-
80
-
81
-
82
-
83
-
84
-
85
-
86
-
87
-
88
 |
 |

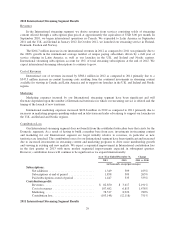
Revenues
The $79.2 million increase in our international revenues in 2011 as compared to 2010 reflects a full year of
service offering in Canada as well as our launch in Latin America.
Cost of Revenues
International cost of revenues increased by $100.7 million in 2011 as compared to 2010 primarily due to an
increase of $90.1 million in content licensing costs resulting from the continued investments in streaming content
available for viewing in Canada and to support our launch in Latin America.
Marketing
International marketing expenses increased $69.6 million in 2011 as compared to 2010 primarily due to
increases in marketing program spending in television and online to support our launch in Latin America.
Consolidated Operating Expenses
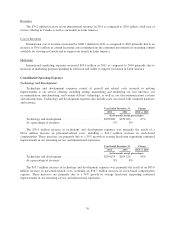
Technology and Development
Technology and development expenses consist of payroll and related costs incurred in making
improvements to our service offering, including testing, maintaining and modifying our user interface, our
recommendation, merchandising, and content delivery technology, as well as, our telecommunications systems
and infrastructures. Technology and development expenses also include costs associated with computer hardware
and software.
Year Ended December 31, Change
2012 2011 2012 vs. 2011
(in thousands, except percentages)
Technology and development ......................... $329,008 $259,033 27%
As a percentage of revenues ........................... 9% 8%
The $70.0 million increase in technology and development expenses was primarily the result of a
$63.4 million increase in personnel-related costs, including a $12.7 million increase in stock-based
compensation. These increases are primarily due to a 35% growth in average headcount supporting continued
improvements in our streaming service and international expansion.
Year Ended December 31, Change
2011 2010 2011 vs. 2010
(in thousands, except percentages)
Technology and development ......................... $259,033 $163,329 59%
As a percentage of revenues ........................... 8% 8%
The $95.7 million increase in technology and development expenses was primarily the result of an $83.0
million increase in personnel-related costs, including an $18.7 million increase in stock-based compensation
expense. These increases are primarily due to a 54% growth in average headcount supporting continued
improvements in our streaming service and international expansion.
30