NetFlix 2012 Annual Report Download - page 31
Download and view the complete annual report
Please find page 31 of the 2012 NetFlix annual report below. You can navigate through the pages in the report by either clicking on the pages listed below, or by using the keyword search tool below to find specific information within the annual report.-
 1
1 -
2
-
3
-
4
-
5
-
6
-
7
-
8
-
9
-
10
-
11
-
12
-
13
-
14
-
15
-
16
-
17
-
18
-
19
-
20
-
 21
21 -
 22
22 -
 23
23 -
 24
24 -
 25
25 -
 26
26 -
 27
27 -
 28
28 -
 29
29 -
 30
30 -
 31
31 -
 32
32 -
 33
33 -
 34
34 -
 35
35 -
 36
36 -
 37
37 -
 38
38 -
 39
39 -
 40
40 -
 41
41 -
42
-
43
-
44
-
45
-
46
-
47
-
48
-
49
-
50
-
51
-
52
-
53
-
54
-
55
-
56
-
57
-
58
-
59
-
60
-
61
-
62
-
63
-
64
-
65
-
66
-
67
-
68
-
69
-
70
-
71
-
72
-
73
-
74
-
75
-
76
-
77
-
78
-
79
-
80
-
81
-
82
-
83
-
84
-
85
-
86
-
87
-
88
 |
 |

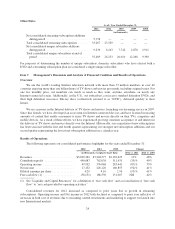
Customers electing access to high definition Blu-ray discs in addition to standard definition DVDs pay a
surcharge ranging from $2 to $4 per month for our most popular plans.
The $200.0 million increase in our domestic revenues in 2012 as compared to 2011 was primarily due to the
15% growth in the domestic average number of unique paying subscribers driven by new streaming
subscriptions. This increase was offset in part by an 8% decline in domestic average monthly revenue per unique
paying subscriber, resulting from the decline in DVD subscriptions. We expect streaming subscriptions
domestically to continue to grow while DVD subscription declines continue to moderate.
Cost of Revenues
The $217.9 million increase in domestic cost of revenues in 2012 as compared to 2011 was primarily due to
the following factors:
• Content acquisition and licensing expenses increased by $397.7 million. This increase was primarily
attributable to continued investments in existing and new streaming content available for viewing to our
subscribers as compared to the prior year.
• Content delivery expenses decreased by $162.0 million primarily due to a 41% decrease in the number of
DVDs mailed to paying subscribers driven by a decline in the number of DVD subscriptions.
• Other costs associated with content processing and customer service center expenses decreased by
$13.9 million primarily due to a decrease in hub operation expenses resulting from the declines in DVD
shipments, offset partially by increases in customer service center expenses to support our growth in
domestic subscriptions.
Marketing
Marketing expenses decreased $40.7 million in 2012 as compared to 2011 primarily due to a decrease in
marketing program spending in television, radio and direct mail advertising partially offset by increases in online
advertising.
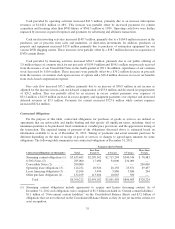
Contribution Profit
Our Domestic streaming segment had a contribution margin of 16% for 2012 and our Domestic DVD
segment had a contribution margin of 47%. The Domestic segments collectively had a contribution margin of
27% in 2012 down slightly from 28% in 2011 with the decrease driven primarily by investments in our streaming
content. We expect contribution margins for the Domestic DVD segment to decline sequentially due to a
seasonal increase in usage in the first quarter of 2013 and the expected USPS rate increase of $0.01 each way
which takes effect in January 2013. Contribution margins for the Domestic streaming segment are expected to
expand as investments in domestic content and marketing grow slower than domestic streaming revenues and
contribution profit may exceed the Domestic DVD contribution profit in the first quarter of 2013.
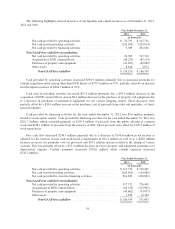
As of /Year Ended December 31, Change
2011 2010 2011 vs. 2010
(in thousands, except percentages)
Subscribers:
Unique Domestic
Net additions ............................. 4,894 7,233 (32)%
Subscribers at end of period ................. 24,395 19,501 25%
Paid subscribers at end of period .............. 22,858 17,935 27%
Total Domestic
Revenues ................................ $3,121,727 $2,159,008 45%
Cost of revenues .......................... 1,932,419 1,350,542 43%
Marketing ................................ 324,121 284,917 14%
Contribution profit ......................... 865,187 523,549 65%
Contribution margin ....................... 28% 24%
27