NetFlix 2012 Annual Report Download - page 30
Download and view the complete annual report
Please find page 30 of the 2012 NetFlix annual report below. You can navigate through the pages in the report by either clicking on the pages listed below, or by using the keyword search tool below to find specific information within the annual report.-
 1
1 -
2
-
3
-
4
-
5
-
6
-
7
-
8
-
9
-
10
-
11
-
12
-
13
-
14
-
15
-
16
-
17
-
18
-
19
-
 20
20 -
 21
21 -
 22
22 -
 23
23 -
 24
24 -
 25
25 -
 26
26 -
 27
27 -
 28
28 -
 29
29 -
 30
30 -
 31
31 -
 32
32 -
 33
33 -
 34
34 -
 35
35 -
 36
36 -
 37
37 -
 38
38 -
 39
39 -
 40
40 -
41
-
42
-
43
-
44
-
45
-
46
-
47
-
48
-
49
-
50
-
51
-
52
-
53
-
54
-
55
-
56
-
57
-
58
-
59
-
60
-
61
-
62
-
63
-
64
-
65
-
66
-
67
-
68
-
69
-
70
-
71
-
72
-
73
-
74
-
75
-
76
-
77
-
78
-
79
-
80
-
81
-
82
-
83
-
84
-
85
-
86
-
87
-
88
 |
 |

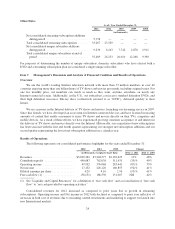
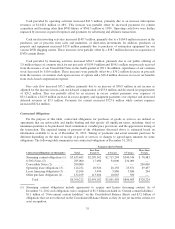
• As a result of our focus on growing the streaming segments, contribution margins for the Domestic and
International streaming segments are lower than for our Domestic DVD segment. Also impacting the
Domestic streaming segment was a loss of subscribers resulting from the negative consumer reaction to
the pricing and plan changes announced in July 2011. We expect that the investments in content and
marketing associated with the Domestic and International streaming segments will slow relative to
revenues to allow for contribution margin expansion over time.
Domestic Segments
As of /Year Ended December 31, Change
2012 2011 2012 vs. 2011
(in thousands, except percentages)
Subscriptions:
Domestic Streaming
Net additions ............................ 5,475 n/a
Subscriptions at end of period .............. 27,146 21,671 25%
Paid subscriptions at end of period ........... 25,471 20,153 26%
Domestic DVD
Net losses .............................. (2,941) n/a
Subscriptions at end of period .............. 8,224 11,165 (26)%
Paid subscriptions at end of period ........... 8,049 11,039 (27)%
Subscribers:
Unique Domestic
Net additions ............................ 4,973 4,894 2%
Subscribers at end of period ................ 29,368 24,395 20%
Paid subscribers at end of period ............ 27,613 22,858 21%
Contribution profit:
Domestic Streaming
Revenues ............................... $2,184,868 n/a
Cost of revenues ......................... 1,558,864 n/a
Marketing .............................. 276,072 n/a
Contribution profit ....................... 349,932 n/a
Contribution margin ...................... 16%
Domestic DVD
Revenues ............................... $1,136,872 n/a
Cost of revenues ......................... 591,432 n/a
Marketing .............................. 7,374 n/a
Contribution profit ....................... 538,066 n/a
Contribution margin ...................... 47%
Total Domestic
Revenues ............................... $3,321,740 $3,121,727 6%
Cost of revenues ......................... 2,150,296 1,932,419 11%
Marketing .............................. 283,446 324,121 (13)%
Contribution profit ....................... 887,998 865,187 3%
Contribution margin ...................... 27% 28%
2012 Domestic Segment Results
Revenues
In the Domestic streaming segment, we derive revenues from services consisting solely of streaming content
offered through a subscription plan priced at $7.99 per month. In the Domestic DVD segment, we derive
revenues from our DVDs-by-mail subscription services. The price per plan for DVDs-by-mail varies from
$4.99 to $43.99 per month based on the number of DVDs that a subscriber may have out at any given point.
26