NetFlix 2012 Annual Report Download - page 29
Download and view the complete annual report
Please find page 29 of the 2012 NetFlix annual report below. You can navigate through the pages in the report by either clicking on the pages listed below, or by using the keyword search tool below to find specific information within the annual report.-
 1
1 -
2
-
3
-
4
-
5
-
6
-
7
-
8
-
9
-
10
-
11
-
12
-
13
-
14
-
15
-
16
-
17
-
18
-
 19
19 -
 20
20 -
 21
21 -
 22
22 -
 23
23 -
 24
24 -
 25
25 -
 26
26 -
 27
27 -
 28
28 -
 29
29 -
 30
30 -
 31
31 -
 32
32 -
 33
33 -
 34
34 -
 35
35 -
 36
36 -
 37
37 -
 38
38 -
 39
39 -
40
-
41
-
42
-
43
-
44
-
45
-
46
-
47
-
48
-
49
-
50
-
51
-
52
-
53
-
54
-
55
-
56
-
57
-
58
-
59
-
60
-
61
-
62
-
63
-
64
-
65
-
66
-
67
-
68
-
69
-
70
-
71
-
72
-
73
-
74
-
75
-
76
-
77
-
78
-
79
-
80
-
81
-
82
-
83
-
84
-
85
-
86
-
87
-
88
 |
 |
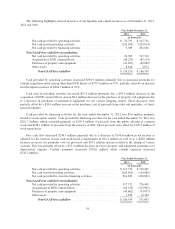
Free cash flow for the year ended December 31, 2012 decreased $244.7 million as compared to 2011 to
negative $58.2 million. Significant uses of cash in the year were cash payments for content (in excess of the
expense), and cash payments related to income taxes. These uses of cash were partially offset by net income
excluding the impact of non-cash stock compensation and deferred revenue. We expect excess content payments
over expense to continue to fluctuate over time both domestically and internationally. Payment terms for certain
streaming licenses, especially programming that initially airs in the applicable territory on our service (“original
programming”) or that is considered output content, will typically require more up-front cash payments than
other licensing agreements. Due to the expected receipt timing of original programming content, content cash
payments in excess of expense and free cash flow will be materially more negative in the first quarter of 2013 as
compared to the fourth quarter of 2012, but free cash flow is expected to improve in subsequent quarters.
Prior to July 2011, in the U.S., our streaming and DVDs-by-mail operations were combined and subscribers
could receive both streaming content and DVDs under a single “hybrid” plan. In July 2011, we introduced DVD
only plans and separated the combined plans, making it necessary for subscribers who wish to receive both
streaming services and DVDs-by-mail to have two separate subscription plans. As subscribers were able to
receive both streaming and DVDs-by-mail under a single hybrid plan prior to the fourth quarter of 2011, it is
impracticable to allocate revenues and expenses to the Domestic streaming and Domestic DVD segments prior to
the fourth quarter of 2011.
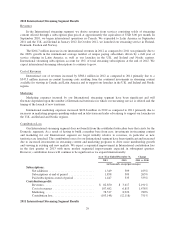
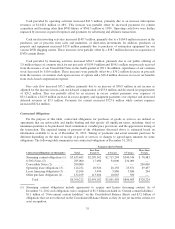
Our core strategy is to grow a streaming subscription business domestically and internationally. We are
continuously improving the customer experience, with a focus on expanding our streaming content, enhancing
our user interface and extending our streaming service to even more Internet-connected devices, while staying
within the parameters of our consolidated net income (loss) and operating segment contribution profit (loss)
targets. As we grow our streaming subscription segments, we have shifted spending away from the Domestic
DVD segment to invest more in streaming content and marketing our streaming services.
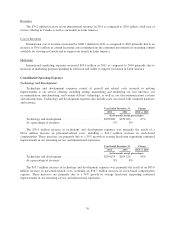
• We define contribution profit as revenues less cost of revenues and marketing expenses. We believe this
is an important measure of our operating segment performance.
• For the Domestic and International streaming segments, content licensing expenses, which includes the
amortization of the streaming content library and other expenses associated with the licensing of
streaming content, represent the vast majority of cost of revenues. Streaming content rights are generally
specific to a geographic region and accordingly our international expansion will require us to obtain
additional streaming content licenses to support new international markets. Other cost of revenues such
as content delivery expenses, customer service and payment card fees tend to be lower as a percentage of
total cost of revenues. We utilize both our own and third-party content delivery networks to help us
efficiently stream content in high volume to our subscribers over the Internet. Content delivery expenses
therefore also include equipment costs related to Open Connect and all third-party costs associated with
delivering streaming content over the Internet. Cost of revenues in the Domestic DVD segment consists
primarily of expenses related to the acquisition of content including amortization of DVD content library
and revenue sharing expenses, content delivery and other expenses associated with our DVD processing
and customer service centers. Content delivery expenses for the Domestic DVD segment consist of the
postage costs to mail DVDs to and from our paying subscribers and the packaging and label costs for the
mailers.
• For the Domestic and International streaming segments, marketing expenses consist primarily of
advertising expenses and payments made to our affiliates and consumer electronics partners and also
include payroll related expenses. Advertising expenses include promotional activities such as television
and online advertising as well as allocated costs of revenues relating to free trial periods. Payments to our
affiliates and consumer electronics partners may be in the form of a fixed fee or may be a revenue
sharing payment. Marketing costs as a percentage of revenues are higher for the Domestic and
International streaming segments given our focus on building consumer awareness of the streaming
offerings. Marketing costs are immaterial for the Domestic DVD segment.
25