NetFlix 2012 Annual Report Download - page 57
Download and view the complete annual report
Please find page 57 of the 2012 NetFlix annual report below. You can navigate through the pages in the report by either clicking on the pages listed below, or by using the keyword search tool below to find specific information within the annual report.-
 1
1 -
2
-
3
-
4
-
5
-
6
-
7
-
8
-
9
-
10
-
11
-
12
-
13
-
14
-
15
-
16
-
17
-
18
-
19
-
20
-
21
-
22
-
23
-
24
-
25
-
26
-
27
-
28
-
29
-
30
-
31
-
32
-
33
-
34
-
35
-
36
-
37
-
38
-
39
-
40
-
41
-
42
-
43
-
44
-
45
-
46
-
 47
47 -
 48
48 -
 49
49 -
 50
50 -
 51
51 -
 52
52 -
 53
53 -
 54
54 -
 55
55 -
 56
56 -
 57
57 -
 58
58 -
 59
59 -
 60
60 -
 61
61 -
 62
62 -
 63
63 -
 64
64 -
 65
65 -
 66
66 -
 67
67 -
68
-
69
-
70
-
71
-
72
-
73
-
74
-
75
-
76
-
77
-
78
-
79
-
80
-
81
-
82
-
83
-
84
-
85
-
86
-
87
-
88
 |
 |

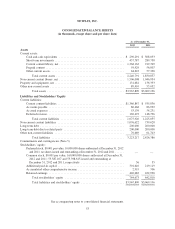
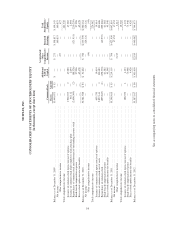
NETFLIX, INC.
CONSOLIDATED BALANCE SHEETS
(in thousands, except share and per share data)
As of December 31,
2012 2011
Assets
Current assets:
Cash and cash equivalents ............................................ $ 290,291 $ 508,053
Short-term investments ............................................... 457,787 289,758
Current content library, net ............................................ 1,368,162 919,709
Prepaid content ..................................................... 59,929 56,007
Other current assets .................................................. 64,622 57,330
Total current assets .............................................. 2,240,791 1,830,857
Non-current content library, net ............................................ 1,506,008 1,046,934
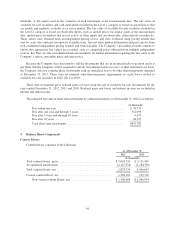
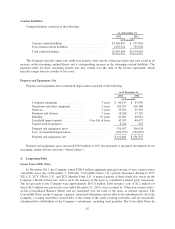
Property and equipment, net ............................................... 131,681 136,353
Other non-current assets .................................................. 89,410 55,052
Total assets .................................................... $3,967,890 $3,069,196
Liabilities and Stockholders’ Equity
Current liabilities:
Current content liabilities ............................................. $1,366,847 $ 935,036
Accounts payable ................................................... 86,468 86,992
Accrued expenses ................................................... 53,139 54,231
Deferred revenue .................................................... 169,472 148,796
Total current liabilities ........................................... 1,675,926 1,225,055
Non-current content liabilities ............................................. 1,076,622 739,628
Long-term debt ......................................................... 200,000 200,000
Long-term debt due to related party ......................................... 200,000 200,000
Other non-current liabilities ............................................... 70,669 61,703
Total liabilities ................................................. 3,223,217 2,426,386
Commitments and contingencies (Note 5)
Stockholders’ equity:
Preferred stock, $0.001 par value; 10,000,000 shares authorized at December 31, 2012
and 2011; no shares issued and outstanding at December 31, 2012 and 2011 ...... — —
Common stock, $0.001 par value; 160,000,000 shares authorized at December 31,
2012 and 2011; 55,587,167 and 55,398,615 issued and outstanding at
December 31, 2012 and 2011, respectively ............................. 56 55
Additional paid-in capital ............................................. 301,616 219,119
Accumulated other comprehensive income ............................... 2,919 706
Retained earnings ................................................... 440,082 422,930
Total stockholders’ equity ........................................ 744,673 642,810
Total liabilities and stockholders’ equity ............................. $3,967,890 $3,069,196
See accompanying notes to consolidated financial statements.
53